Web Scraping - It’s Your Civic Duty
Posted by Chris Moffitt in articles
Introduction
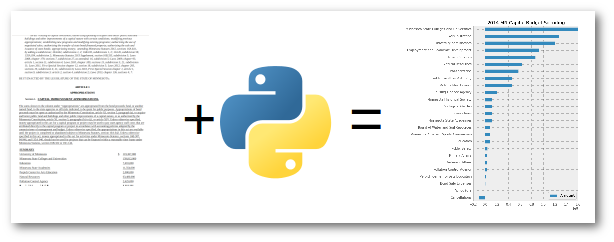
More and more information from local, state and federal governments is being placed on the web. However, a lot of the data is not presented in a way that is easy to download and manipulate. I think it is an important civic duty for us all to be aware of how government money is spent. Having the data in a more accessible format is a first step in that process.
In this article, I’ll use BeautifulSoup to scrape some data from the Minnesota 2014 Capital Budget. Then I’ll load the data into a pandas DataFrame and create a simple plot showing where the money is going.
My purpose in writing this is not to make any specific political statements about this data set. I chose this data because:
- I personally found it interesting
- I think it translates well across other states and across the world
- It highlights several useful python tools both in and outside of the stdlib
- The process is applicable to other domains outside of government data
- It is a manageable size so you can understand it using basic tools
The Data
I live in MN so thought I would take a look at what sort of budget information is available to us via the various state websites. To be honest, there is a lot of information but it seems like the vast majority is stored in a PDF or on an HTML page.
I applaud the state for making the data available but it is not easy to analyze the data in the way it is currently presented. As I looked through the Minnesota government website, I found this 2014 Capital Budget page which is actually pretty straightforward to understand.
The first part of the document contains a high level summary of all the projects receiving capital dollars as well as how the capital budget will be funded.
The second part of the document has a lot of detail on each of the summary items. For the purpose of this exercise, I am only going to scrape the summary section but the same basic principle can be applied to the detailed line items.
One final note, I realize that this data set is not that large and that you could easily type it all into Excel. However, if we were to scale this to pull in more data, you quickly get to the point where hand typing the data just does not make sense. The principles I walk through will scale to much larger sets. I hope it has the added bonus that you will learn something as well. I know I enjoyed working on this little project.
The Tools
For this particular task, I am going to use 2 very common python tools for scraping the site:
- BeautifulSoup to parse the data
- Requests to get the data from the website.
Strictly speaking, Requests is not being used for much in this case but I think it makes sense to start using it. If/when you start getting more complicated situations, you’ll be happy you are already using it.
Scrapy is another powerful tool for doing web scraping but for my needs BeautifulSoup was perfect so that’s what I’m sticking with for this article. Maybe I’ll look at it for a future article.
Once I scrape the data, I’ll convert it to a pandas DataFrame so that I can analyze and plot the data.
One final note, I’m trying to use idiomatic python as much as possible. My current environment is python 2.7
but I’ll use the
print_function
to make the python 3 conversion much easier. Also, I’m going to use
the
defaultdict
to streamline the processing of the data. This was first introduced in python 2.5 and
is pretty handy when working with dictionaries where the values are lists.
Start the Process
Import all the modules we need:
from __future__ import print_function
import os.path
from collections import defaultdict
import string
import requests
from bs4 import BeautifulSoup
import pandas as pd
import numpy as np
import matplotlib.pyplot as plt
Now we need to initialize the variables. I’m going to use two dictionaries. One will store
all of the expense items and the other will include the funding source. Note, I am not
going to store the total. We can calculate it so we’ll skip that piece of data. I am using the
defaultdict
to make it easy to append the values I scrape:
url = "https://www.revisor.mn.gov/laws/?year=2014&type=0&doctype=Chapter&id=294"
# Init the variables
# Use a defaultdict with an empty list because it eases the DataFrame creation
expense_lines = defaultdict(list)
funding_lines = defaultdict(list)
funding = False
Use requests to get the data and pass it to BeautifulSoup. In my final script, I’m going to store the HTML to disk so that I don’t need to hit the website every time I run it. I won’t show it in this section in order to keep the code short.
result = requests.get(url)
c = result.content
# Now that we have the data, let's process it
soup = BeautifulSoup(c)
Understand Your HTML
The key to understanding any scraping is looking at the HTML and understanding how you want to pull your data out.
In this case, I downloaded the HTML into an editor and collapsed some of the data. It is very helpful that there is a div that wraps the data I need:
<p class="enacting_clause">BE IT ENACTED BY THE LEGISLATURE OF THE STATE OF MINNESOTA:</p>
  <div class="article" id="laws.1.0.0">
    <h1 class="article_no">ARTICLE 1</h1>
    <h1 class="article_header">APPROPRIATIONS</h1>
    <div class="bill_section" id="laws.1.1.0">
Within that div, there are mutliple tables which ultimately contain the info we need:
<div class="bill_section" id="laws.1.1.0">
     <table>
       <col style="width:100%"/>
       <tr>
         <td style="border-bottom: 1px solid transparent; border-right: 1px solid transparent;" valign="bottom">
           <h1 class="bill_sec_no">Section 1. </h1>
           <h3 class="headnote">
             <span class="new" style="text-decoration: underline">CAPITAL IMPROVEMENT APPROPRIATIONS.</span>
           </h3>
         </td>
       </tr>
     </table>
     <p class="first">
     </p>
     <table>
Finally, here is a row of data:
<tr>
          <td style="border-bottom: 1px solid transparent; border-right: 1px solid transparent;" valign="bottom">
            <span class="new" style="text-decoration: underline">University of Minnesota</span>
          </td>
          <td style="border-bottom: 1px solid transparent; border-right: 1px solid transparent;" valign="bottom">
            <span class="new" style="text-decoration: underline">$</span>
          </td>
          <td style="border-bottom: 1px solid transparent; border-right: 1px solid transparent;" valign="bottom">
            <span class="new" style="text-decoration: underline">119,367,000</span>
          </td>
        </tr>
In the example above, we want to parse out two pieces of data - the description (Universty of Minnesota) and the amount (119,367,000).
Another item to note is that the number comes through with commas as well as parenthesis for negative values so we are going to need to clean it up a little. I also found that I pulled in a lot of extra white space in the process, so using
string.strip
is a good idea.
Here is the clean up function we’ll use:
def convert_num(val):
    """
    Convert the string number value to a float
     - Remove all extra whitespace
     - Remove commas
     - If wrapped in (), then it is negative number
    """
    val = string.strip(val).replace(",","").replace("(","-").replace(")","")
    return float(val)
Parse the HTML
Now that we know how to get to our tables, use BeautifulSoup’s powerful API to get at our data.
# After looking at the data, we can see that the summary has a div id we can use
summary = soup.find("div", {"class":"bill_section","id": "laws.1.1.0"})

# Get all the tables in the summary
tables = summary.find_all('table')

# The first table is not useful header info
# The second table contains all the we need (the list is 0 indexed)
data_table = tables[1]
Parse each row in the table and add to the appropriate dictionary depending on whether it is a funding line or expense line:
#Go through each row of the table and pull out our data
for row in data_table.find_all("tr"):
    cells = row.find_all("td")
    # Ignore lines that don't have 3 cells of data because it is just spacing
    if len(cells) == 3:
        line = (string.strip(cells[0].text), convert_num(cells[2].text))
        # Once we get to the total line we start getting the funding lines
        if line[0] == "TOTAL":
            funding = True
            # We don't want to capture the total because we can calc it
            continue
        if funding:
            funding_lines[line[0]].append(line[1])
        else:
            expense_lines[line[0]].append(line[1])
Convert the Data
Our dictionaries contain the data we need, let’s add them to a pandas DataFrame using
DataFrame.from_dict()
:
# Create the DataFrame using from_dict
expense_df = pd.DataFrame.from_dict(expense_lines,orient='index')
funding_df = pd.DataFrame.from_dict(funding_lines,orient='index')
# Label our column
expense_df.rename(columns={0: 'Amount'}, inplace=True)
funding_df.rename(columns={0: 'Amount'}, inplace=True)
First, we look at a small subset of the spending lines:
expense_df.head()
| Amount | |
|---|---|
| Administration | 127000000 |
| Bond Sale Expenses | 900000 |
| Minnesota State Academies | 11354000 |
| Public Facilities Authority | 45993000 |
| Housing Finance Agency | 20000000 |
Then look at how it is funded.
funding_df
| Amount | |
|---|---|
| State Transportation Fund | 36613000 |
| Trunk Highway Fund | 7950000 |
| Bond Proceeds Fund (User Financed Debt Service) | 39104000 |
| Bond Proceeds Cancellations | -10849000 |
| Maximum Effort School Loan Fund | 5491000 |
| Bond Proceeds Fund (General Fund Debt Service) | 814745000 |
We can check our totals too to make sure we processed the data correctly.
expense_df["Amount"].sum()
893054000.0
funding_df["Amount"].sum()
893054000.0
It looks like everything was processed correctly. Now, we can analyze the data any way we want.
Plot The Data
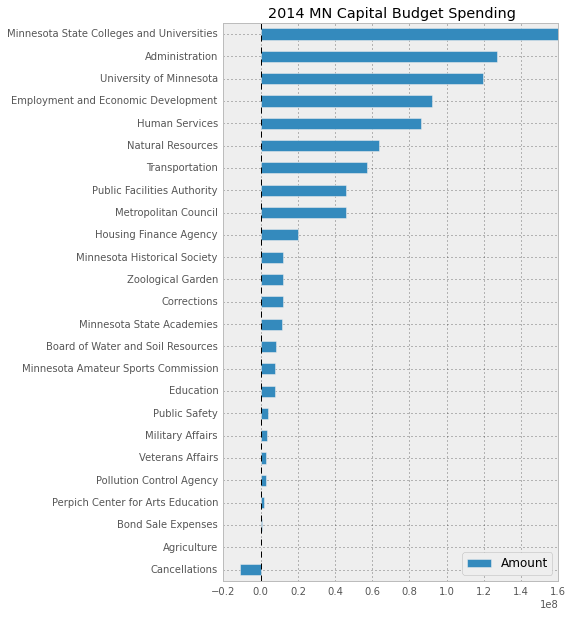
In this specific case, I am going to generate a simple horizontal bar graph so that it is easy to see where the biggest expenditures are.
First, I’ll sort both sets of data:
expense_df = expense_df.sort(columns='Amount')
funding_df = funding_df.sort(columns='Amount')
pd.options.display.mpl_style = 'default'
Set our default plot style so it looks nicer:
pd.options.display.mpl_style = 'default'
Plot horizontal bar chart
expense_df.plot(kind='barh', figsize=[6, 10],title="2014 MN Capital Budget Spending")
For comparison, here is what the image looks like if you don’t set
pd.options.display.mpl_style
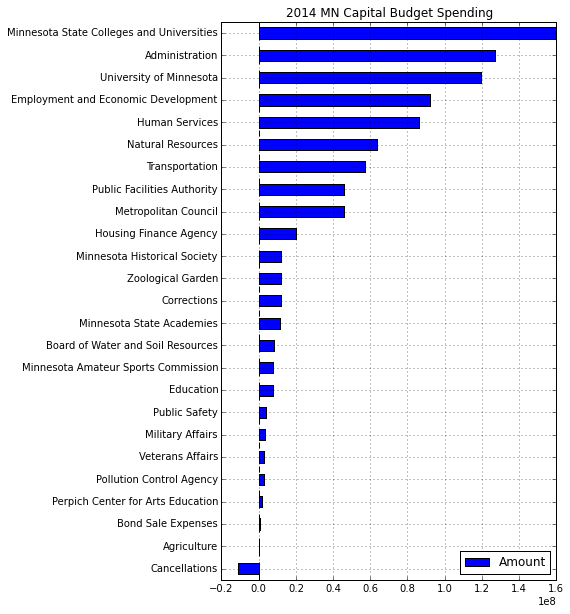
Regardless of the format, I think you’ll agree that viewing the capital budget in this plot yields a lot more insight than the raw HTML data.
Final Thoughts
This little project has been useful for me and I hope it provides a starting point for you to understand how to use various python tools to scrape the web. In this case, I learned a little bit that I think could be applicable to lots of other projects. I also am curious about this little slice of data and intend to look into it some more and see what insight I can glean.
For reference, here is the complete code for this example. This version will download the data to a file and use that locally instead of hitting the site each time.
#Parse 2014 MN Capital budget - https://www.revisor.mn.gov/laws/?year=2014&type=0&doctype=Chapter&id=294
#Store the summary in a DataFrame for eventual manipulation
from __future__ import print_function
import os.path
from collections import defaultdict
import string
import requests
from bs4 import BeautifulSoup
import pandas as pd
import numpy as np
import matplotlib.pyplot as plt

filename = "MNBudget-2014.html"
url = "https://www.revisor.mn.gov/laws/?year=2014&type=0&doctype=Chapter&id=294"

def convert_num(val):
    """
    Convert the string number value to a float
     - Remove all extra whitespace
     - Remove commas
     - If wrapped in (), then it is negative number
    """
    val = string.strip(val).replace(",","").replace("(","-").replace(")","")
    return float(val)

# As we work through the process, it is easier to
# download it once and work with the saved copy instead of
# trying to hit the server each time
# Just delete the output file to force a new download
if os.path.isfile(filename):
    print("Loading the data via the file.")
    f = open(filename, 'r')
    c = f.read()
else:
    print("Fetching the data via the URL.")
    result = requests.get(url)
    c = result.content
    f = open(filename,'w')
    f.write(c)
f.close()

# Init the variables
# Use a defaultdict with an empty list because it eases the DataFrame creation
expense_lines = defaultdict(list)
funding_lines = defaultdict(list)
funding = False

# Now that we have the data, let's process it
soup = BeautifulSoup(c)

# After looking at the data, we can see that the summary has a div id we can use
summary = soup.find("div", {"class":"bill_section","id": "laws.1.1.0"})

# Get all the tables in the summary
tables = summary.find_all('table')

# The first table is not useful header info
# The second table contains all the we need (the list is 0 indexed)
data_table = tables[1]

#Go through each row of the table and pull out our data
for row in data_table.find_all("tr"):
    cells = row.find_all("td")
    # Ignore lines that don't have 3 cells of data because it is just spacing
    if len(cells) == 3:
        line = (string.strip(cells[0].text), convert_num(cells[2].text))
        # Once we get to the total line we start getting the funding lines
        if line[0] == "TOTAL":
            funding = True
            # We don't want to capture the total because we can calc it
            continue
        if funding:
            funding_lines[line[0]].append(line[1])
        else:
            expense_lines[line[0]].append(line[1])

# Create the DataFrame using from_dict
expense_df = pd.DataFrame.from_dict(expense_lines,orient='index')
funding_df = pd.DataFrame.from_dict(funding_lines,orient='index')
# Label our column
expense_df.rename(columns={0: 'Amount'}, inplace=True)
funding_df.rename(columns={0: 'Amount'}, inplace=True)

expense_df = expense_df.sort(columns='Amount')
funding_df = funding_df.sort(columns='Amount')

print(expense_df["Amount"].sum())
print(funding_df["Amount"].sum())

#Set some nicer defaults for plots
pd.options.display.mpl_style = 'default'

expense_bar = expense_df.plot(kind='barh', figsize=[7, 13],title="2014 MN Capital Budget Spending")
plt.savefig("MN-2014-Expense.png")

funding_bar = funding_df.plot(kind='barh',title="2014 MN Capital Budget Funding")
plt.savefig("MN-2014-Funding.png")
Comments