Generating Excel Reports from a Pandas Pivot Table
Posted by Chris Moffitt in articles
Introduction
The previous pivot table article described how to use the pandas
pivot_table
function to
combine and present data in an easy to view manner. This concept is probably
familiar to anyone that has used pivot tables in Excel. However, pandas
has the capability to easily take a cross section of the data and manipulate it.
This cross section capability makes a pandas pivot table really useful for generating custom reports.
This article will give a short example of how to manipulate the data in a pivot table to
create a custom Excel report with a subset of pivot table data.
I was really excited once I figured this out and I think it is a really useful feature that lots of folks will be able to use. My hope is that once you understand this functionality, you’ll appreciate the pandas pivot table even more than you do now.
The Problem
I have to believe that anyone that has created a pivot table in Excel has had the need (at one time or another) to break the data into multiple “chunks” for distribution to various people.
For example, if we had this pivot table:

We would really like to send a seperate report (or seperate tabs in one file) to each manager (Debra and Fred in this example). How would you do this in Excel? In my experience, I would normally just copy and paste - I’m not too proud to admit I’ve done that. Others might write VBA. There may even be other options I haven’t figured out.
Bottom line: it’s a hassle.
Pandas has a solution to help you out - DataFrame.xs . Have you ever heard of it? Me neither. Even after reading the documentation it might not be clear to you how useful it can be. Once you understand what it does, I think you’ll immmediately see the usefulness for generating custom reports/spreadsheets from your own pivot tables using the cross-section function.
XS Explained
The easiest way to understand
xs
is to show an example. I will take a data example
from the pivot table article.
First we get the data uploaded into a simple pivot table. Do my standard imports, read in the data and create my pivot table:
import pandas as pd
import numpy as np

df = pd.read_excel("sales-funnel.xlsx")
table = pd.pivot_table(df,index=["Manager","Rep","Product"],
               values=["Price","Quantity"],
               aggfunc=[np.sum,np.mean],fill_value=0)
table
| sum | mean | |||||
|---|---|---|---|---|---|---|
| Price | Quantity | Price | Quantity | |||
| Manager | Rep | Product | ||||
| Debra Henley | Craig Booker | CPU | 65000 | 2 | 32500 | 1.0 |
| Maintenance | 5000 | 2 | 5000 | 2.0 | ||
| Software | 10000 | 1 | 10000 | 1.0 | ||
| Daniel Hilton | CPU | 105000 | 4 | 52500 | 2.0 | |
| Software | 10000 | 1 | 10000 | 1.0 | ||
| John Smith | CPU | 35000 | 1 | 35000 | 1.0 | |
| Maintenance | 5000 | 2 | 5000 | 2.0 | ||
| Fred Anderson | Cedric Moss | CPU | 95000 | 3 | 47500 | 1.5 |
| Maintenance | 5000 | 1 | 5000 | 1.0 | ||
| Software | 10000 | 1 | 10000 | 1.0 | ||
| Wendy Yule | CPU | 165000 | 7 | 82500 | 3.5 | |
| Maintenance | 7000 | 3 | 7000 | 3.0 | ||
| Monitor | 5000 | 2 | 5000 | 2.0 | ||
This is fairly straightforward once you understand the
pivot_table
syntax.
Now, let’s take a look at what
xs
can do:
table.xs('Debra Henley', level=0)
| sum | mean | ||||
|---|---|---|---|---|---|
| Price | Quantity | Price | Quantity | ||
| Rep | Product | ||||
| Craig Booker | CPU | 65000 | 2 | 32500 | 1 |
| Maintenance | 5000 | 2 | 5000 | 2 | |
| Software | 10000 | 1 | 10000 | 1 | |
| Daniel Hilton | CPU | 105000 | 4 | 52500 | 2 |
| Software | 10000 | 1 | 10000 | 1 | |
| John Smith | CPU | 35000 | 1 | 35000 | 1 |
| Maintenance | 5000 | 2 | 5000 | 2 | |
Ok, this is pretty interesting.
xs
allows me to drill down to one cross-section of the pivot table.
We can drill down multiple levels as well. If we want to just see one rep’s results:
table.xs(('Debra Henley','Craig Booker'), level=0)
| sum | mean | |||
|---|---|---|---|---|
| Price | Quantity | Price | Quantity | |
| Product | ||||
| CPU | 65000 | 2 | 32500 | 1 |
| Maintenance | 5000 | 2 | 5000 | 2 |
| Software | 10000 | 1 | 10000 | 1 |
If you’re like me, you just had light bulb go off and realize that a lot of cutting and pasting you have done in Excel can be a thing of the past.
We need the
get_level_values
to make this work as seamlessly as possible.
For example, if we want to see all the Manager values:
table.index.get_level_values(0)
Index([u'Debra Henley', u'Debra Henley', u'Debra Henley', u'Debra Henley', u'Debra Henley', u'Debra Henley', u'Debra Henley', u'Fred Anderson', u'Fred Anderson', u'Fred Anderson', u'Fred Anderson', u'Fred Anderson', u'Fred Anderson'], dtype='object')
If we want to see all the rep values:
table.index.get_level_values(1)
Index([u'Craig Booker', u'Craig Booker', u'Craig Booker', u'Daniel Hilton', u'Daniel Hilton', u'John Smith', u'John Smith', u'Cedric Moss', u'Cedric Moss', u'Cedric Moss', u'Wendy Yule', u'Wendy Yule', u'Wendy Yule'], dtype='object')
To make it a little simpler for iterating, use
unique
:
table.index.get_level_values(0).unique()
array([u'Debra Henley', u'Fred Anderson'], dtype=object)
Now it should be clear what we’re about to do. I’ll print it out first so you can see.
for manager in table.index.get_level_values(0).unique():
    print(table.xs(manager, level=0))
                              sum            mean
                            Price Quantity  Price Quantity
Rep           Product
Craig Booker  CPU           65000        2  32500        1
              Maintenance    5000        2   5000        2
              Software      10000        1  10000        1
Daniel Hilton CPU          105000        4  52500        2
              Software      10000        1  10000        1
John Smith    CPU           35000        1  35000        1
              Maintenance    5000        2   5000        2
                            sum            mean
                          Price Quantity  Price Quantity
Rep         Product
Cedric Moss CPU           95000        3  47500      1.5
            Maintenance    5000        1   5000      1.0
            Software      10000        1  10000      1.0
Wendy Yule  CPU          165000        7  82500      3.5
            Maintenance    7000        3   7000      3.0
            Monitor        5000        2   5000      2.0
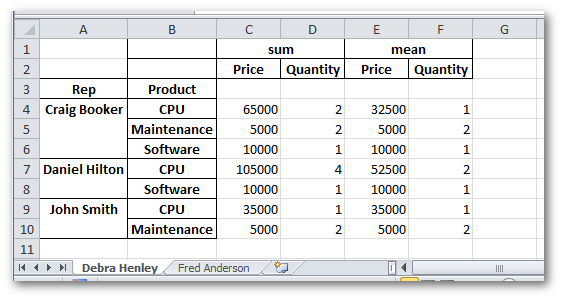
As we pull it all together, it is super simple to create a single Excel sheet with one tab per manager:
writer = pd.ExcelWriter('output.xlsx')

for manager in table.index.get_level_values(0).unique():
    temp_df = table.xs(manager, level=0)
    temp_df.to_excel(writer,manager)

writer.save()
You now get an output that looks like this:
Stop and Think
As you sit back and think about this code, just take a second to revel in how much we are doing with 7 lines of code (plus 2 imports):
import pandas as pd
import numpy as np

df = pd.read_excel("sales-funnel.xlsx")
table = pd.pivot_table(df,index=["Manager","Rep","Product"], values=["Price","Quantity"],aggfunc=[np.sum,np.mean],fill_value=0)
writer = pd.ExcelWriter('output.xlsx')
for manager in table.index.get_level_values(0).unique():
    temp_df = table.xs(manager, level=0)
    temp_df.to_excel(writer,manager)
writer.save()
We have just read in an Excel file, created a powerful summary of data, then broken the data up into an output Excel file with separate tabs for each manager. Just by using 9 lines of code!
I think my excitement about this functionality is warranted.
Taking It One Step Further
In some cases, you might want to generate separate files per manager or do some other manipulation. It should be pretty simple to understand how to do so given the examples above.
To close out this discussion, I decided I would wrap things up with a fully functional program that utilizes additional python functions to make this script a truly useful program that utilizes good python programming practices so that you can scale it up for your own needs:
"""
Sample report generation script from pbpython.com

This program takes an input Excel file, reads it and turns it into a
pivot table.

The output is saved in multiple tabs in a new Excel file.
"""

import argparse
import pandas as pd
import numpy as np


def create_pivot(infile, index_list=["Manager", "Rep", "Product"],
                 value_list=["Price", "Quantity"]):
    """
    Read in the Excel file, create a pivot table and return it as a DataFrame
    """
    df = pd.read_excel(infile)
    table = pd.pivot_table(df, index=index_list,
                           values=value_list,
                           aggfunc=[np.sum, np.mean], fill_value=0)
    return table


def save_report(report, outfile):
    """
    Take a report and save it to a single Excel file
    """
    writer = pd.ExcelWriter(outfile)
    for manager in report.index.get_level_values(0).unique():
        temp_df = report.xs(manager, level=0)
        temp_df.to_excel(writer, manager)
    writer.save()

if __name__ == "__main__":
    parser = argparse.ArgumentParser(description='Script to generate sales report')
    parser.add_argument('infile', type=argparse.FileType('r'),
                        help="report source file in Excel")
    parser.add_argument('outfile', type=argparse.FileType('w'),
                        help="output file in Excel")
    args = parser.parse_args()
    # We need to pass the full file name instead of the file object
    sales_report = create_pivot(args.infile.name)
    save_report(sales_report, args.outfile.name)
There are other things you could do to this file to make it even more portable but this should give you the idea. If you are interested, I’ve posted a gist so people can make forks and update if they want.
Conclusion
I am really excited about learning how to use this functionality to create customized pandas reports in Excel. I also found it useful to put this in a standalone python script that has sophisticated argument parsing and is robust enough that you could hand it off to a less skilled user to generate a report.
So, be honest. Do you think this is as handy as I do?
Comments