Common Excel Tasks Demonstrated in Pandas
Posted by Chris Moffitt in articles
Introduction
The purpose of this article is to show some common Excel tasks and how you would execute similar tasks in pandas. Some of the examples are somewhat trivial but I think it is important to show the simple as well as the more complex functions you can find elsewhere. As an added bonus, I’m going to do some fuzzy string matching to show a little twist to the process and show how pandas can utilize the full python system of modules to do something simply in python that would be complex in Excel.
Make sense? Let’s get started.
Adding a Sum to a Row
The first task I’ll cover is summing some columns to add a total column.
We will start by importing our excel data into a pandas dataframe.
import pandas as pd
import numpy as np
df = pd.read_excel("excel-comp-data.xlsx")
df.head()
| account | name | street | city | state | postal-code | Jan | Feb | Mar | |
|---|---|---|---|---|---|---|---|---|---|
| 0 | 211829 | Kerluke, Koepp and Hilpert | 34456 Sean Highway | New Jaycob | Texas | 28752 | 10000 | 62000 | 35000 |
| 1 | 320563 | Walter-Trantow | 1311 Alvis Tunnel | Port Khadijah | NorthCarolina | 38365 | 95000 | 45000 | 35000 |
| 2 | 648336 | Bashirian, Kunde and Price | 62184 Schamberger Underpass Apt. 231 | New Lilianland | Iowa | 76517 | 91000 | 120000 | 35000 |
| 3 | 109996 | D’Amore, Gleichner and Bode | 155 Fadel Crescent Apt. 144 | Hyattburgh | Maine | 46021 | 45000 | 120000 | 10000 |
| 4 | 121213 | Bauch-Goldner | 7274 Marissa Common | Shanahanchester | California | 49681 | 162000 | 120000 | 35000 |
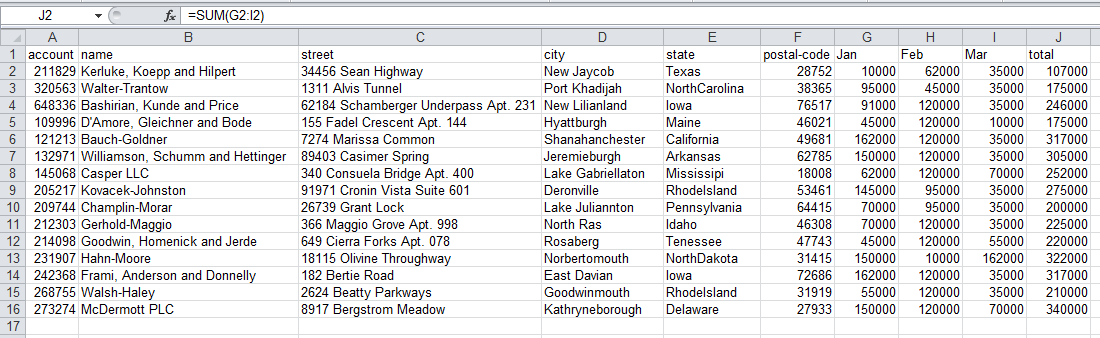
We want to add a total column to show total sales for Jan, Feb and Mar.
This is straightforward in Excel and in pandas. For Excel, I have added the formula
sum(G2:I2)
in column J.
Here is what it looks like in Excel:
Next, here is how we do it in pandas:
df["total"] = df["Jan"] + df["Feb"] + df["Mar"]
df.head()
| account | name | street | city | state | postal-code | Jan | Feb | Mar | total | |
|---|---|---|---|---|---|---|---|---|---|---|
| 0 | 211829 | Kerluke, Koepp and Hilpert | 34456 Sean Highway | New Jaycob | Texas | 28752 | 10000 | 62000 | 35000 | 107000 |
| 1 | 320563 | Walter-Trantow | 1311 Alvis Tunnel | Port Khadijah | NorthCarolina | 38365 | 95000 | 45000 | 35000 | 175000 |
| 2 | 648336 | Bashirian, Kunde and Price | 62184 Schamberger Underpass Apt. 231 | New Lilianland | Iowa | 76517 | 91000 | 120000 | 35000 | 246000 |
| 3 | 109996 | D’Amore, Gleichner and Bode | 155 Fadel Crescent Apt. 144 | Hyattburgh | Maine | 46021 | 45000 | 120000 | 10000 | 175000 |
| 4 | 121213 | Bauch-Goldner | 7274 Marissa Common | Shanahanchester | California | 49681 | 162000 | 120000 | 35000 | 317000 |
Next, let’s get some totals and other values for each month. Here is what we are trying to do as shown in Excel:
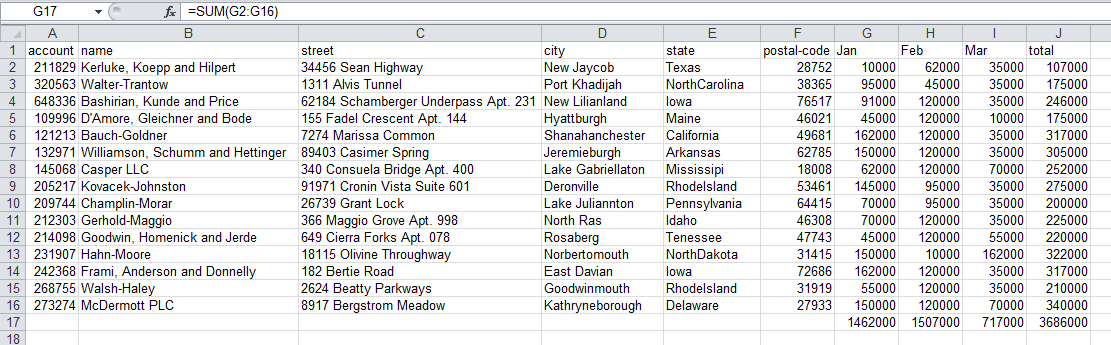
As you can see, we added a
SUM(G2:G16)
in row 17 in each of the columns to get
totals by month.
Performing column level analysis is easy in pandas. Here are a couple of examples.
df["Jan"].sum(), df["Jan"].mean(),df["Jan"].min(),df["Jan"].max()
(1462000, 97466.666666666672, 10000, 162000)
Now, we want to add a total by month and grand total. This is where pandas and Excel diverge a little. It is very simple to add totals in cells in Excel for each month. Because pandas need to maintain the integrity of the entire DataFrame, there are a couple more steps.
First, create a sum for the month and total columns.
sum_row=df[["Jan","Feb","Mar","total"]].sum()
sum_row
Jan      1462000
Feb      1507000
Mar       717000
total    3686000
dtype: int64
This is fairly intuitive however, if you want to add totals as a row, you need to do some minor manipulations.
We need to transpose the data and convert the Series to a DataFrame so
that it is easier to concat onto our existing data. The
T
function
allows us to switch the data from being row-based to column-based.
df_sum=pd.DataFrame(data=sum_row).T
df_sum
| Jan | Feb | Mar | total | |
|---|---|---|---|---|
| 0 | 1462000 | 1507000 | 717000 | 3686000 |
The final thing we need to do before adding the totals back is to add
the missing columns. We use
reindex
to do this for us. The trick is to
add all of our columns and then allow pandas to fill in the values that
are missing.
df_sum=df_sum.reindex(columns=df.columns)
df_sum
| account | name | street | city | state | postal-code | Jan | Feb | Mar | total | |
|---|---|---|---|---|---|---|---|---|---|---|
| 0 | NaN | NaN | NaN | NaN | NaN | NaN | 1462000 | 1507000 | 717000 | 3686000 |
Now that we have a nicely formatted DataFrame, we can add it to our
existing one using
append
.
df_final=df.append(df_sum,ignore_index=True)
df_final.tail()
| account | name | street | city | state | postal-code | Jan | Feb | Mar | total | |
|---|---|---|---|---|---|---|---|---|---|---|
| 11 | 231907 | Hahn-Moore | 18115 Olivine Throughway | Norbertomouth | NorthDakota | 31415 | 150000 | 10000 | 162000 | 322000 |
| 12 | 242368 | Frami, Anderson and Donnelly | 182 Bertie Road | East Davian | Iowa | 72686 | 162000 | 120000 | 35000 | 317000 |
| 13 | 268755 | Walsh-Haley | 2624 Beatty Parkways | Goodwinmouth | RhodeIsland | 31919 | 55000 | 120000 | 35000 | 210000 |
| 14 | 273274 | McDermott PLC | 8917 Bergstrom Meadow | Kathryneborough | Delaware | 27933 | 150000 | 120000 | 70000 | 340000 |
| 15 | NaN | NaN | NaN | NaN | NaN | NaN | 1462000 | 1507000 | 717000 | 3686000 |
Additional Data Transforms
For another example, let’s try to add a state abbreviation to the data set.
From an Excel perspective the easiest way is probably to add a new column, do a vlookup on the state name and fill in the abbreviation.
I did this and here is a snapshot of what the results looks like:
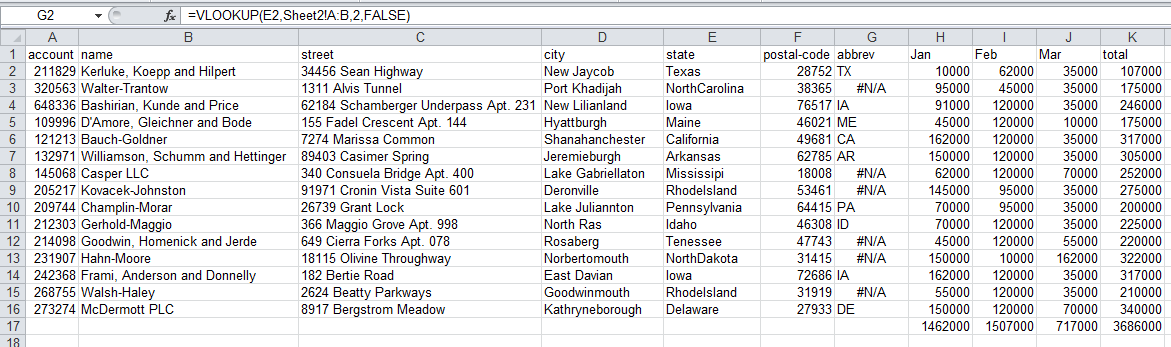
You’ll notice that after performing the vlookup, there are some values that are not coming through correctly. That’s because we misspelled some of the states. Handling this in Excel would be really challenging (on big data sets).
Fortunately with pandas we have the full power of the python ecosystem at our disposal. In thinking about how to solve this type of messy data problem, I thought about trying to do some fuzzy text matching to determine the correct value.
Fortunately someone else has done a lot of work in this are. The fuzzy wuzzy library has some pretty useful functions for this type of situation. Make sure to get it and install it first.
The other piece of code we need is a state name to abbreviation mapping. Instead of trying to type it myself, a little googling found this code.
Get started by importing the appropriate fuzzywuzzy functions and define our state map dictionary.
from fuzzywuzzy import fuzz
from fuzzywuzzy import process
state_to_code = {"VERMONT": "VT", "GEORGIA": "GA", "IOWA": "IA", "Armed Forces Pacific": "AP", "GUAM": "GU",
                 "KANSAS": "KS", "FLORIDA": "FL", "AMERICAN SAMOA": "AS", "NORTH CAROLINA": "NC", "HAWAII": "HI",
                 "NEW YORK": "NY", "CALIFORNIA": "CA", "ALABAMA": "AL", "IDAHO": "ID", "FEDERATED STATES OF MICRONESIA": "FM",
                 "Armed Forces Americas": "AA", "DELAWARE": "DE", "ALASKA": "AK", "ILLINOIS": "IL",
                 "Armed Forces Africa": "AE", "SOUTH DAKOTA": "SD", "CONNECTICUT": "CT", "MONTANA": "MT", "MASSACHUSETTS": "MA",
                 "PUERTO RICO": "PR", "Armed Forces Canada": "AE", "NEW HAMPSHIRE": "NH", "MARYLAND": "MD", "NEW MEXICO": "NM",
                 "MISSISSIPPI": "MS", "TENNESSEE": "TN", "PALAU": "PW", "COLORADO": "CO", "Armed Forces Middle East": "AE",
                 "NEW JERSEY": "NJ", "UTAH": "UT", "MICHIGAN": "MI", "WEST VIRGINIA": "WV", "WASHINGTON": "WA",
                 "MINNESOTA": "MN", "OREGON": "OR", "VIRGINIA": "VA", "VIRGIN ISLANDS": "VI", "MARSHALL ISLANDS": "MH",
                 "WYOMING": "WY", "OHIO": "OH", "SOUTH CAROLINA": "SC", "INDIANA": "IN", "NEVADA": "NV", "LOUISIANA": "LA",
                 "NORTHERN MARIANA ISLANDS": "MP", "NEBRASKA": "NE", "ARIZONA": "AZ", "WISCONSIN": "WI", "NORTH DAKOTA": "ND",
                 "Armed Forces Europe": "AE", "PENNSYLVANIA": "PA", "OKLAHOMA": "OK", "KENTUCKY": "KY", "RHODE ISLAND": "RI",
                 "DISTRICT OF COLUMBIA": "DC", "ARKANSAS": "AR", "MISSOURI": "MO", "TEXAS": "TX", "MAINE": "ME"}
Here are some example of how the fuzzy text matching function works.
process.extractOne("Minnesotta",choices=state_to_code.keys())
('MINNESOTA', 95)
process.extractOne("AlaBAMMazzz",choices=state_to_code.keys(),score_cutoff=80)
Now that we know how this works, we create our function to take the state column and convert it to a valid
abbreviation. We use the 80 score_cutoff for this data. You can play
with it to see what number works for your data. You’ll notice that we either return a valid
abbreviation or an
np.nan
so that we have some valid values in the field.
def convert_state(row):
    abbrev = process.extractOne(row["state"],choices=state_to_code.keys(),score_cutoff=80)
    if abbrev:
        return state_to_code[abbrev[0]]
    return np.nan
Add the column in the location we want and fill it with NaN values
df_final.insert(6, "abbrev", np.nan)
df_final.head()
| account | name | street | city | state | postal-code | abbrev | Jan | Feb | Mar | total | |
|---|---|---|---|---|---|---|---|---|---|---|---|
| 0 | 211829 | Kerluke, Koepp and Hilpert | 34456 Sean Highway | New Jaycob | Texas | 28752 | NaN | 10000 | 62000 | 35000 | 107000 |
| 1 | 320563 | Walter-Trantow | 1311 Alvis Tunnel | Port Khadijah | NorthCarolina | 38365 | NaN | 95000 | 45000 | 35000 | 175000 |
| 2 | 648336 | Bashirian, Kunde and Price | 62184 Schamberger Underpass Apt. 231 | New Lilianland | Iowa | 76517 | NaN | 91000 | 120000 | 35000 | 246000 |
| 3 | 109996 | D’Amore, Gleichner and Bode | 155 Fadel Crescent Apt. 144 | Hyattburgh | Maine | 46021 | NaN | 45000 | 120000 | 10000 | 175000 |
| 4 | 121213 | Bauch-Goldner | 7274 Marissa Common | Shanahanchester | California | 49681 | NaN | 162000 | 120000 | 35000 | 317000 |
We use
apply
to add the abbreviations into the approriate column.
df_final['abbrev'] = df_final.apply(convert_state, axis=1)
df_final.tail()
| account | name | street | city | state | postal-code | abbrev | Jan | Feb | Mar | total | |
|---|---|---|---|---|---|---|---|---|---|---|---|
| 11 | 231907 | Hahn-Moore | 18115 Olivine Throughway | Norbertomouth | NorthDakota | 31415 | ND | 150000 | 10000 | 162000 | 322000 |
| 12 | 242368 | Frami, Anderson and Donnelly | 182 Bertie Road | East Davian | Iowa | 72686 | IA | 162000 | 120000 | 35000 | 317000 |
| 13 | 268755 | Walsh-Haley | 2624 Beatty Parkways | Goodwinmouth | RhodeIsland | 31919 | RI | 55000 | 120000 | 35000 | 210000 |
| 14 | 273274 | McDermott PLC | 8917 Bergstrom Meadow | Kathryneborough | Delaware | 27933 | DE | 150000 | 120000 | 70000 | 340000 |
| 15 | NaN | NaN | NaN | NaN | NaN | NaN | NaN | 1462000 | 1507000 | 717000 | 3686000 |
I think this is pretty cool. We have developed a very simple process to intelligently clean up this data. Obviously when you only have 15 or so rows, this is not a big deal. However, what if you had 15,000? You would have to do something manual in Excel to clean this up.
Subtotals
For the final section of this article, let’s get some subtotals by state.
In Excel, we would use the
subtotal
tool to do this for us.
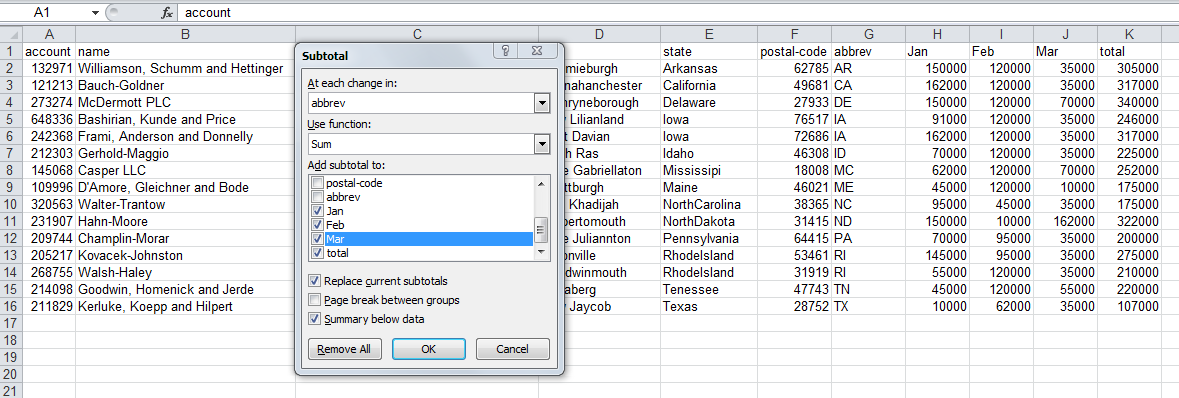
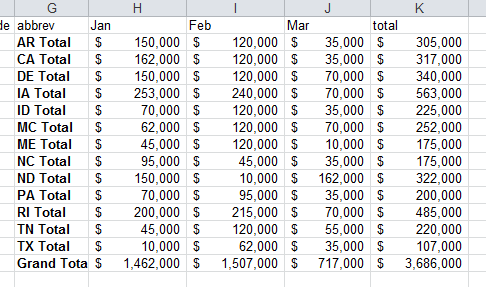
The output would look like this:
Creating a subtotal in pandas, is accomplished using
groupby
df_sub=df_final[["abbrev","Jan","Feb","Mar","total"]].groupby('abbrev').sum()
df_sub
| Jan | Feb | Mar | total | |
|---|---|---|---|---|
| abbrev | ||||
| AR | 150000 | 120000 | 35000 | 305000 |
| CA | 162000 | 120000 | 35000 | 317000 |
| DE | 150000 | 120000 | 70000 | 340000 |
| IA | 253000 | 240000 | 70000 | 563000 |
| ID | 70000 | 120000 | 35000 | 225000 |
| ME | 45000 | 120000 | 10000 | 175000 |
| MS | 62000 | 120000 | 70000 | 252000 |
| NC | 95000 | 45000 | 35000 | 175000 |
| ND | 150000 | 10000 | 162000 | 322000 |
| PA | 70000 | 95000 | 35000 | 200000 |
| RI | 200000 | 215000 | 70000 | 485000 |
| TN | 45000 | 120000 | 55000 | 220000 |
| TX | 10000 | 62000 | 35000 | 107000 |
Next, we want to format the data as currency by using
applymap
to all the values in the
data frame.
def money(x):
    return "${:,.0f}".format(x)

formatted_df = df_sub.applymap(money)
formatted_df
| Jan | Feb | Mar | total | |
|---|---|---|---|---|
| abbrev | ||||
| AR | $150,000 | $120,000 | $35,000 | $305,000 |
| CA | $162,000 | $120,000 | $35,000 | $317,000 |
| DE | $150,000 | $120,000 | $70,000 | $340,000 |
| IA | $253,000 | $240,000 | $70,000 | $563,000 |
| ID | $70,000 | $120,000 | $35,000 | $225,000 |
| ME | $45,000 | $120,000 | $10,000 | $175,000 |
| MS | $62,000 | $120,000 | $70,000 | $252,000 |
| NC | $95,000 | $45,000 | $35,000 | $175,000 |
| ND | $150,000 | $10,000 | $162,000 | $322,000 |
| PA | $70,000 | $95,000 | $35,000 | $200,000 |
| RI | $200,000 | $215,000 | $70,000 | $485,000 |
| TN | $45,000 | $120,000 | $55,000 | $220,000 |
| TX | $10,000 | $62,000 | $35,000 | $107,000 |
The formatting looks good, now we can get the totals like we did earlier.
sum_row=df_sub[["Jan","Feb","Mar","total"]].sum()
sum_row
Jan      1462000
Feb      1507000
Mar       717000
total    3686000
dtype: int64
Convert the values to columns and format it.
df_sub_sum=pd.DataFrame(data=sum_row).T
df_sub_sum=df_sub_sum.applymap(money)
df_sub_sum
| Jan | Feb | Mar | total | |
|---|---|---|---|---|
| 0 | $1,462,000 | $1,507,000 | $717,000 | $3,686,000 |
Finally, add the total value to the DataFrame.
final_table = formatted_df.append(df_sub_sum)
final_table
| Jan | Feb | Mar | total | |
|---|---|---|---|---|
| AR | $150,000 | $120,000 | $35,000 | $305,000 |
| CA | $162,000 | $120,000 | $35,000 | $317,000 |
| DE | $150,000 | $120,000 | $70,000 | $340,000 |
| IA | $253,000 | $240,000 | $70,000 | $563,000 |
| ID | $70,000 | $120,000 | $35,000 | $225,000 |
| ME | $45,000 | $120,000 | $10,000 | $175,000 |
| MS | $62,000 | $120,000 | $70,000 | $252,000 |
| NC | $95,000 | $45,000 | $35,000 | $175,000 |
| ND | $150,000 | $10,000 | $162,000 | $322,000 |
| PA | $70,000 | $95,000 | $35,000 | $200,000 |
| RI | $200,000 | $215,000 | $70,000 | $485,000 |
| TN | $45,000 | $120,000 | $55,000 | $220,000 |
| TX | $10,000 | $62,000 | $35,000 | $107,000 |
| 0 | $1,462,000 | $1,507,000 | $717,000 | $3,686,000 |
You’ll notice that the index is ‘0’ for the total line. We want to change
that using
rename
.
final_table = final_table.rename(index={0:"Total"})
final_table
| Jan | Feb | Mar | total | |
|---|---|---|---|---|
| AR | $150,000 | $120,000 | $35,000 | $305,000 |
| CA | $162,000 | $120,000 | $35,000 | $317,000 |
| DE | $150,000 | $120,000 | $70,000 | $340,000 |
| IA | $253,000 | $240,000 | $70,000 | $563,000 |
| ID | $70,000 | $120,000 | $35,000 | $225,000 |
| ME | $45,000 | $120,000 | $10,000 | $175,000 |
| MS | $62,000 | $120,000 | $70,000 | $252,000 |
| NC | $95,000 | $45,000 | $35,000 | $175,000 |
| ND | $150,000 | $10,000 | $162,000 | $322,000 |
| PA | $70,000 | $95,000 | $35,000 | $200,000 |
| RI | $200,000 | $215,000 | $70,000 | $485,000 |
| TN | $45,000 | $120,000 | $55,000 | $220,000 |
| TX | $10,000 | $62,000 | $35,000 | $107,000 |
| Total | $1,462,000 | $1,507,000 | $717,000 | $3,686,000 |
Conclusion
By now, most people know that pandas can do a lot of complex manipulations on data - similar to Excel. As I have been learning about pandas, I still find myself trying to remember how to do things that I know how to do in Excel but not in pandas. I realize that this comparison may not be exactly fair - they are different tools. However, I hope to reach people that know Excel and want to learn what alternatives are out there for their data processing needs. I hope these examples will help others feel confident that they can replace a lot of their crufty Excel data manipulations with pandas.
I found this exercise helpful to cement these ideas in my mind. I hope it works for you as well. If you have other Excel tasks that you would like to learn how to do in pandas, let me know via the comments below and I will try to help.
Updates
- 25-June-2020 Add a link to sidetable for creating subtotals.
Comments