Forecasting Website Traffic Using Facebook’s Prophet Library
Posted by Chris Moffitt in articles

Introduction
A common business analytics task is trying to forecast the future based on known historical data. Forecasting is a complicated topic and relies on an analyst knowing the ins and outs of the domain as well as knowledge of relatively complex mathematical theories. Because the mathematical concepts can be complex, a lot of business forecasting approaches are “solved” with a little linear regression and “intuition.” More complex models would yield better results but are too difficult to implement.
Given that background, I was very interested to see that Facebook recently open sourced a python and R library called prophet which seeks to automate the forecasting process in a more sophisticated but easily tune-able model. In this article, I’ll introduce prophet and show how to use it to predict the volume of traffic in the next year for Practical Business Python. To make this a little more interesting, I will post the prediction through the end of March so we can take a look at how accurate the forecast is.
Overview of Prophet
For those interested in learning more about prophet, I recommend reading Facebook’s white paper on the topic. The paper is relatively light on math and heavy on the background of forecasting and some of the business challenges associated with building and using forecasting models at scale.
The paper’s introduction contains a good overview of the challenges with current forecasting approaches:
Producing high quality forecasts is not an easy problem for either machines or for most analysts. We have observed two main themes in the practice of creating business forecasts:
1. Completely automatic forecasting techniques can be brittle and they are often too inflexible to incorporate useful assumptions or heuristics.
2. Analysts who can produce high quality forecasts are quite rare because forecasting is a specialized data science skill requiring substantial experience. The result of these themes is that the demand for high quality forecasts often far outstrips the pace at which the organization can produce them.
Prophet seeks to provide a simple to use model that is sophisticated enough to provide useful results - even when run by someone without deep knowledge of the mathematical theories of forecasting. However, the modeling solution does provide several tuneable parameters so that analysts can easily make changes to the model based on their unique business needs.
Installation
Before going any further, make sure to install prophet. The complex statistical modeling is handled by the Stan library and is a prerequisite for prophet. As long as you are using anaconda, the installation process is pretty simple:
conda install pystan
pip install fbprophet
Starting the Analysis
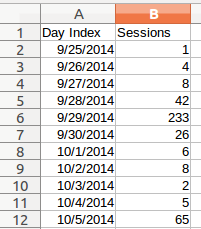
For this analysis, I will be using a spreadsheet of the actual web traffic volume from pbpython starting in Sept 2014 and going through early March 2017. The data is downloaded from Google analytics and looks like this:
import pandas as pd
import numpy as np
from fbprophet import Prophet

data_file = "All Web Site Data Audience Overview.xlsx"
df = pd.read_excel(data_file)
df.head()
| Day Index | Sessions | |
|---|---|---|
| 0 | 2014-09-25 | 1 |
| 1 | 2014-09-26 | 4 |
| 2 | 2014-09-27 | 8 |
| 3 | 2014-09-28 | 42 |
| 4 | 2014-09-29 | 233 |
The first thing we need to check is to make sure the Day Index column came through as a datetime type:
df.dtypes
Day Index    datetime64[ns]
Sessions              int64
dtype: object
Since that looks good, let’s see what kind of insight we can get with just simple pandas plots:
df.set_index('Day Index').plot();
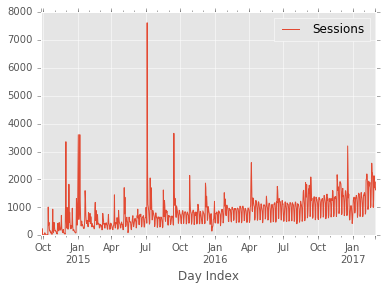
The basic plot is interesting but, like most time series data, it is difficult to get much out of this without doing further analysis. Additionally, if you wanted to add a predicted trend-line, it is a non-trivial task with stock pandas.
Before going further, I do want to address the outlier in the July 2015 timeframe. My
most popular article is Pandas Pivot Table Explained which saw the biggest traffic spike
on this blog. Since that article represents an outlier in volume, I am going to
change those values to
nan
so that it does not unduly influence the projection.
This change is not strictly required but it will be useful to show that prophet can handle this missing data without further manipulation. This process also highlights the need for the analyst to still be involved in the process of making the forecast.
df.loc[(df['Sessions'] > 5000), 'Sessions'] = np.nan
df.set_index('Day Index').plot();
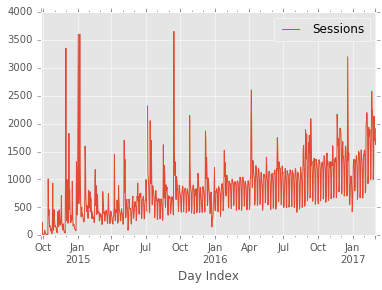
This is pretty good but I am going to do one other data transformation
before continuing. I will convert the
Sessions
column to be a log
value. This article has more information on why a log transform is useful for
these types of data sets. From the article:
… logging converts multiplicative relationships to additive relationships, and by the same token it converts exponential (compound growth) trends to linear trends. By taking logarithms of variables which are multiplicatively related and/or growing exponentially over time, we can often explain their behavior with linear models.
df['Sessions'] = np.log(df['Sessions'])
df.set_index('Day Index').plot();

The data set is almost ready to make a prediction. The final step is to rename
the columns to
ds
and
y
in order to comply with the prophet API.
df.columns = ["ds", "y"]
df.head()
| ds | y | |
|---|---|---|
| 0 | 2014-09-25 | 0.000000 |
| 1 | 2014-09-26 | 1.386294 |
| 2 | 2014-09-27 | 2.079442 |
| 3 | 2014-09-28 | 3.737670 |
| 4 | 2014-09-29 | 5.451038 |
Now that the data is cleaned and labeled correctly, let’s see what prophet can do with it.
Making a Prediction
The prophet API is similar to scikit-learn. The general flow is to
fit
the
data then
predict
the future time series. In addition, prophet supports
some nice plotting features using
plot
and
plot_components
.
Create the first model (m1) and fit the data to our dataframe:
m1 = Prophet()
m1.fit(df)
In order to tell prophet how far to predict in the future, use
make_future_dataframe.
In this example, we will predict out 1 year (365 days).
future1 = m1.make_future_dataframe(periods=365)
Then make the forecast:
forecast1 = m1.predict(future1)
The
forecast1
is just a pandas dataframe with a several columns of data.
The predicted value is called
yhat
and the range is defined by
yhat_lower
and
yhat_upper
. To see the last 5 predicted values:
forecast1[['ds', 'yhat', 'yhat_lower', 'yhat_upper']].tail()
| ds | yhat | yhat_lower | yhat_upper | |
|---|---|---|---|---|
| 1250 | 2018-02-27 | 7.848040 | 6.625887 | 9.081303 |
| 1251 | 2018-02-28 | 7.787314 | 6.565903 | 9.008327 |
| 1252 | 2018-03-01 | 7.755146 | 6.517481 | 8.948139 |
| 1253 | 2018-03-02 | 7.552382 | 6.309191 | 8.785648 |
| 1254 | 2018-03-03 | 7.011651 | 5.795778 | 8.259777 |
To convert back to the numerical values representing sessions, use
np.exp
np.exp(forecast1[['yhat', 'yhat_lower', 'yhat_upper']].tail())
| yhat | yhat_lower | yhat_upper | |
|---|---|---|---|
| 1250 | 2560.709477 | 754.373407 | 8789.412841 |
| 1251 | 2409.836175 | 710.452848 | 8170.840734 |
| 1252 | 2333.549138 | 676.871358 | 7693.563414 |
| 1253 | 1905.275686 | 549.600404 | 6539.712030 |
| 1254 | 1109.484324 | 328.907843 | 3865.233952 |
To make this look nice and impress management, plot the data:
m1.plot(forecast1);
Very cool. The other useful feature is the ability to plot the various components:
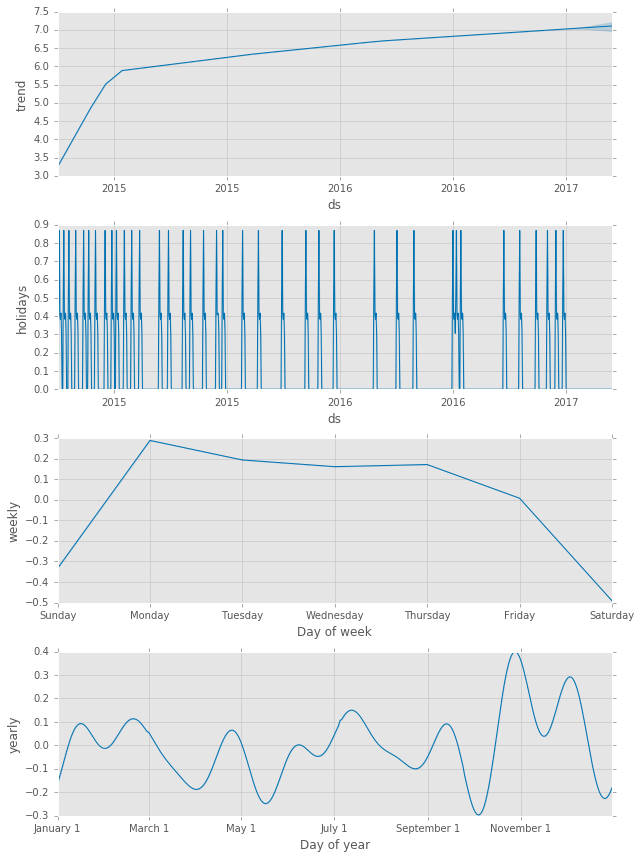
m1.plot_components(forecast1);
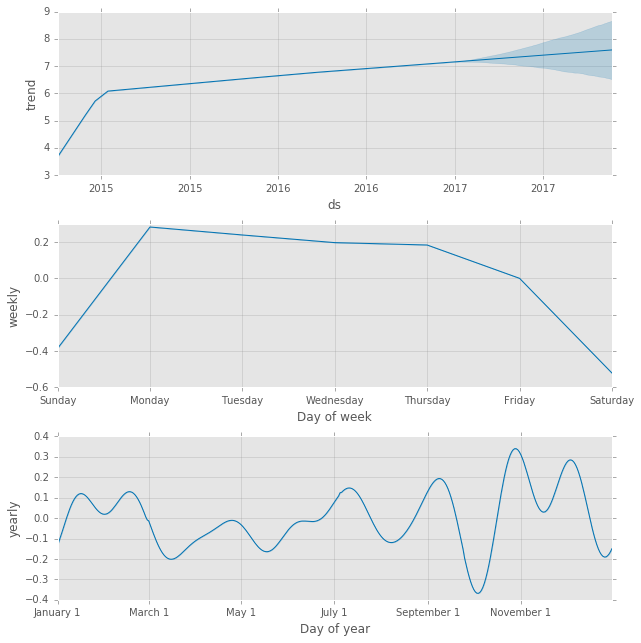
I really like this view because it is a very simple way to pull out the daily and weekly trends. For instance, the charts make it easy to see that Monday-Thursday are peak times with big fall offs on the weekend. Additionally, I appear to have bigger jumps in traffic towards the end of the year.
Refining the Model
I hope you’ll agree that the basic process to create a model is relatively straightforward and you can see that the results include more rigor than a simple linear trend line. Where prophet really shines is the ability to iterate the models with different assumptions and inputs.
One of the features that prophet supports is the concept of a “holiday.” The simplest way to think about this idea is the typical up-tick in store sales seen around the Thanksgiving and Christmas holidays. If we have certain known events that have major impacts on our time series, we can define them and the model will use these data points to try to make better future predictions.
For this blog, any time a new article is published, there is an uptick in traffic for
about 1 week, then there is a slow decay back to steady state. Therefore for this
analysis, we can define a holiday as a blog post. Since I know that the post
drives increased traffic for about 5-7 days, I can define an
upper_window
to encapsulate those 5 days in that holiday window. There is also a corresponding
lower_window
for days leading up to the holiday. For this analysis, I will
only look at the upper_window.
To capture the holidays, define a holiday dataframe with a datestamp and the description of the holiday:
articles = pd.DataFrame({
  'holiday': 'publish',
  'ds': pd.to_datetime(['2014-09-27', '2014-10-05', '2014-10-14', '2014-10-26', '2014-11-9',
                        '2014-11-18', '2014-11-30', '2014-12-17', '2014-12-29', '2015-01-06',
                        '2015-01-20', '2015-02-02', '2015-02-16', '2015-03-23', '2015-04-08',
                        '2015-05-04', '2015-05-17', '2015-06-09', '2015-07-02', '2015-07-13',
                        '2015-08-17', '2015-09-14', '2015-10-26', '2015-12-07', '2015-12-30',
                        '2016-01-26', '2016-04-06', '2016-05-16', '2016-06-15', '2016-08-23',
                        '2016-08-29', '2016-09-06', '2016-11-21', '2016-12-19', '2017-01-17',
                        '2017-02-06', '2017-02-21', '2017-03-06']),
  'lower_window': 0,
  'upper_window': 5,
})
articles.head()
| ds | holiday | lower_window | upper_window | |
|---|---|---|---|---|
| 0 | 2014-09-27 | publish | 0 | 5 |
| 1 | 2014-10-05 | publish | 0 | 5 |
| 2 | 2014-10-14 | publish | 0 | 5 |
| 3 | 2014-10-26 | publish | 0 | 5 |
| 4 | 2014-11-09 | publish | 0 | 5 |
Astute readers may have noticed that you can include dates in the future. In this instance, I am including today’s blog post in the holiday dataframe.
To use the publish dates in the model, pass it to the model via the
holidays
keyword. Perform the normal
fit
,
make_future
(this time we’ll try 90 days),
predict
and
plot
:
m2 = Prophet(holidays=articles).fit(df)
future2 = m2.make_future_dataframe(periods=90)
forecast2 = m2.predict(future2)
m2.plot(forecast2);

Because we have defined holidays, we get a little more information when we plot components:
m2.plot_components(forecast2);
Predictions
Prophet offers a couple of other options for continuing to tweak the model. I
encourage you to play around with them to get a feel for how they work and what
and can be used for your models. I have included one new option
mcmc_samples
in the final example below.
As promised, here is my forecast for website traffic between today and the end of March:
m3 = Prophet(holidays=articles, mcmc_samples=500).fit(df)
future3 = m3.make_future_dataframe(periods=90)
forecast3 = m3.predict(future3)
forecast3["Sessions"] = np.exp(forecast3.yhat).round()
forecast3["Sessions_lower"] = np.exp(forecast3.yhat_lower).round()
forecast3["Sessions_upper"] = np.exp(forecast3.yhat_upper).round()
forecast3[(forecast3.ds > "3-5-2017") &
          (forecast3.ds < "4-1-2017")][["ds", "yhat", "Sessions_lower",
                                        "Sessions", "Sessions_upper"]]
| ds | yhat | Sessions_lower | Sessions | Sessions_upper | |
|---|---|---|---|---|---|
| 892 | 2017-03-06 | 7.845280 | 1432.0 | 2554.0 | 4449.0 |
| 893 | 2017-03-07 | 8.087120 | 1795.0 | 3252.0 | 5714.0 |
| 894 | 2017-03-08 | 7.578796 | 1142.0 | 1956.0 | 3402.0 |
| 895 | 2017-03-09 | 7.556725 | 1079.0 | 1914.0 | 3367.0 |
| 896 | 2017-03-10 | 7.415903 | 917.0 | 1662.0 | 2843.0 |
| 897 | 2017-03-11 | 6.796987 | 483.0 | 895.0 | 1587.0 |
| 898 | 2017-03-12 | 6.627355 | 417.0 | 755.0 | 1267.0 |
| 899 | 2017-03-13 | 7.240586 | 811.0 | 1395.0 | 2341.0 |
The model passes the intuitive test in that there is a big spike anticipated with the publishing of this article. The upper and lower bounds represent a fairly large range but for the purposes of this forecast, that is likely acceptable.
To keep me honest, you can see all of the values in the github notebook.
Final Thoughts
It is always interesting to get insights into the ways big companies use various open source tools in the their business. I am impressed with the functionality that Facebook has given us with prophet. The API is relatively simple and since it uses the standard panda’s dataframe and matplotlib for displaying the data, it fits very easily into the python datascience workflow. There is a lot if recent github activity for this library so I suspect it to get more useful and powerful over the months ahead.
As Yogi Berra said, “It’s tough to make predictions, especially about the future.” I think this library is going to be very useful for people trying to improve their forecasting approaches. I will be interested to see how well this particular forecast works on this site’s data. Stay tuned for an update where I will compare the prediction against the actuals and we will see what insight can be gained.
Updates
- May 23, 2017: Published an update on the predictions.
Comments