Reading HTML tables with Pandas
Posted by Chris Moffitt in articles
Introduction
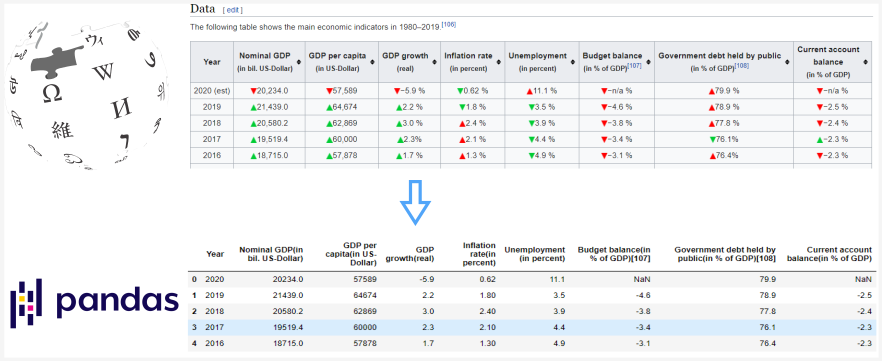
The pandas read_html() function is a quick and convenient way to turn an HTML
table into a pandas DataFrame. This function can be useful for quickly incorporating tables
from various websites without figuring out how to scrape the site’s HTML.
However, there can be some challenges in cleaning and formatting the data before analyzing
it. In this article, I will discuss how to use pandas
read_html()
to read and
clean several Wikipedia HTML tables so that you can use them for further numeric analysis.
Basic Usage
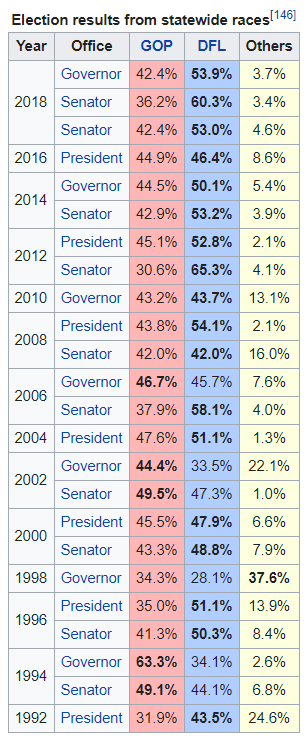
For the first example, we will try to parse this table from the Politics section on the Minnesota wiki page.
The basic usage is of pandas
read_html
is pretty simple and works well on many Wikipedia
pages since the tables are not complicated. To get started, I am including some extra imports
we will use for data cleaning for more complicated examples:
import pandas as pd
import numpy as np
import matplotlib.pyplot as plt
from unicodedata import normalize

table_MN = pd.read_html('https://en.wikipedia.org/wiki/Minnesota')
The unique point here is that
table_MN
is a list of all the tables on the page:
print(f'Total tables: {len(table_MN)}')
Total tables: 38
With 38 tables, it can be challenging to find the one you need. To make the table selection easier,
use the
match
parameter to select a subset of tables. We can use the caption
“Election results from statewide races” to select the table:
table_MN = pd.read_html('https://en.wikipedia.org/wiki/Minnesota', match='Election results from statewide races')
len(table_MN)
1
df = table_MN[0]
df.head()
| Year | Office | GOP | DFL | Others | |
|---|---|---|---|---|---|
| 0 | 2018 | Governor | 42.4% | 53.9% | 3.7% |
| 1 | 2018 | Senator | 36.2% | 60.3% | 3.4% |
| 2 | 2018 | Senator | 42.4% | 53.0% | 4.6% |
| 3 | 2016 | President | 44.9% | 46.4% | 8.6% |
| 4 | 2014 | Governor | 44.5% | 50.1% | 5.4% |
Pandas makes it easy to read in the table and also handles the year column that spans multiple rows. This is an example where it is easier to use pandas than to try to scrape it all yourself.
Overall, this looks ok until we look at the data types with
df.info()
:
<class 'pandas.core.frame.DataFrame'>
RangeIndex: 24 entries, 0 to 23
Data columns (total 5 columns):
#   Column  Non-Null Count  Dtype
---  ------  --------------  -----
0   Year    24 non-null     int64
1   Office  24 non-null     object
2   GOP     24 non-null     object
3   DFL     24 non-null     object
4   Others  24 non-null     object
dtypes: int64(1), object(4)
memory usage: 1.1+ KB
We need to convert the GOP, DFL and Other columns to numeric values if we want to do any analysis.
If we try:
df['GOP'].astype('float')
We get an error:
ValueError: could not convert string to float: '42.4%'
The most likely culprit is the
%
. We can get rid of it using pandas
replace()
function. I covered this in some detail in a previous article.
df['GOP'].replace({'%':''}, regex=True).astype('float')
Which looks good:
0     42.4
1     36.2
2     42.4
3     44.9
<...>
21    63.3
22    49.1
23    31.9
Name: GOP, dtype: float64
Note, that I had to use the
regex=True
parameter for this to work since the
%
is a part of the string and not the full string value.
Now, we can call replace all the
%
values and convert to numbers using
pd.to_numeric()
and
apply()
df = df.replace({'%': ''}, regex=True)
df[['GOP', 'DFL', 'Others']] = df[['GOP', 'DFL', 'Others']].apply(pd.to_numeric)
df.info()
<class 'pandas.core.frame.DataFrame'>
RangeIndex: 24 entries, 0 to 23
Data columns (total 5 columns):
#   Column  Non-Null Count  Dtype
---  ------  --------------  -----
0   Year    24 non-null     int64
1   Office  24 non-null     object
2   GOP     24 non-null     float64
3   DFL     24 non-null     float64
4   Others  24 non-null     float64
dtypes: float64(3), int64(1), object(1)
memory usage: 1.1+ KB
df.head()
| Year | Office | GOP | DFL | Others | |
|---|---|---|---|---|---|
| 0 | 2018 | Governor | 42.4 | 53.9 | 3.7 |
| 1 | 2018 | Senator | 36.2 | 60.3 | 3.4 |
| 2 | 2018 | Senator | 42.4 | 53.0 | 4.6 |
| 3 | 2016 | President | 44.9 | 46.4 | 8.6 |
| 4 | 2014 | Governor | 44.5 | 50.1 | 5.4 |
This basic process works well. The next example is a little trickier.
More Advanced Data Cleaning
The previous example showed the basic concepts. Frequently more cleaning is needed. Here is an example that was a little trickier. This example continues to use Wikipedia but the concepts apply to any site that has data in an HTML table.
What if we wanted to parse the US GDP table show below?
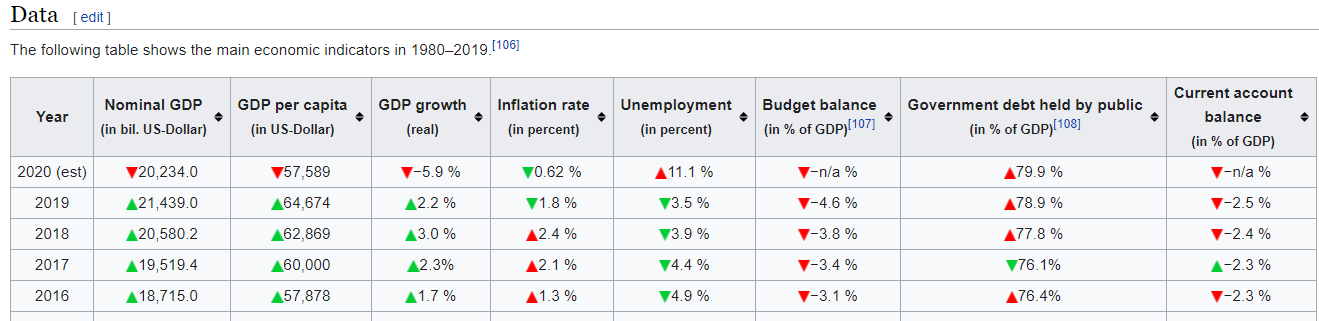
This one was a little harder to use match to get only one table but matching on ‘Nominal GDP’ gets the table we want as the first one in the list.
table_GDP = pd.read_html('https://en.wikipedia.org/wiki/Economy_of_the_United_States', match='Nominal GDP')
df_GDP = table_GDP[0]
df_GDP.info()
<class 'pandas.core.frame.DataFrame'>
RangeIndex: 41 entries, 0 to 40
Data columns (total 9 columns):
#   Column                                            Non-Null Count  Dtype
---  ------                                            --------------  -----
0   Year                                              41 non-null     object
1   Nominal GDP(in bil. US-Dollar)                    41 non-null     float64
2   GDP per capita(in US-Dollar)                      41 non-null     int64
3   GDP growth(real)                                  41 non-null     object
4   Inflation rate(in percent)                        41 non-null     object
5   Unemployment (in percent)                         41 non-null     object
6   Budget balance(in % of GDP)[107]                  41 non-null     object
7   Government debt held by public(in % of GDP)[108]  41 non-null     object
8   Current account balance(in % of GDP)              41 non-null     object
dtypes: float64(1), int64(1), object(7)
memory usage: 3.0+ KB
Not surprisingly we have some cleanup to do. We can try to remove the
%
like we did last time:
df_GDP['GDP growth(real)'].replace({'%': ''}, regex=True).astype('float')
Unfortunately we get this error:
ValueError: could not convert string to float: '−5.9\xa0'
The issue here is that we have a hidden character,
xa0
that is causing some errors.
This is a “non-breaking Latin1 (ISO 8859-1) space”.
One option I played around with was directly removing the value using
replace
. It worked
but I worried about whether or not it would break with other characters in the future.
After going down the unicode rabbit hole, I decided to use
normalize
to clean this
value. I encourage you to read this article for more details on the rationale for my approach.
I also have found issues with extra spaces getting into the data in some of the other tables. I built a small function to clean all the text values. I hope others will find this helpful:
from unicodedata import normalize

def clean_normalize_whitespace(x):
    if isinstance(x, str):
        return normalize('NFKC', x).strip()
    else:
        return x
I can run this function on the entire DataFrame using
applymap
:
df_GDP = df_GDP.applymap(clean_normalize_whitespace)
applymap
performance
applymap
This function is very slow so you should be judicious in using it.The
applymap
function is a very inefficient pandas function. You should not
use it very often but in this case, the DataFrame is small and cleaning like this is tricky
so I think it is a useful trade-off.
One thing that
applymap
misses is the columns. Let’s look at one column in more detail:
df_GDP.columns[7]
'Government debt held by public(in\xa0% of GDP)[108]'
We have that dreaded
xa0%
in the column names. There are a couple of ways we could
go about cleaning the columns but I’m going to use
clean_normalize_whitespace()
on the columns by converting the column to a series and using
apply
to run the function.
Future versions of pandas may make this a little easier.
df_GDP.columns = df_GDP.columns.to_series().apply(clean_normalize_whitespace)
df_GDP.columns[7]
'Government debt held by public(in % of GDP)[108]'
Now we have some of the hidden characters cleaned out. What next?
Let’s try it out again:
df_GDP['GDP growth(real)'].replace({'%': ''}, regex=True).astype('float')
ValueError: could not convert string to float: '−5.9 '
This one is really tricky. If you look really closely, you might be able to tell that the
−
looks a little different than the
-
. It’s hard to see but there is actually
a difference between the unicode dash and minus. Ugh.
Fortunately, we can use
replace
to clean that up too:
df_GDP['GDP growth(real)'].replace({'%': '', '−': '-'}, regex=True).astype('float')
0    -5.9
1     2.2
2     3.0
3     2.3
4     1.7
<...>
38   -1.8
39    2.6
40   -0.2
Name: GDP growth(real), dtype: float64
One other column we need to look at is the
Year
column. For 2020, it contains “2020 (est)”
which we want to get rid of. Then convert the column to an int. I can add to the dictionary but
have to escape the parentheses since they are special characters in a regular expression:
df['Year'].replace({'%': '', '−': '-', '\(est\)': ''}, regex=True).astype('int')
0     2020
1     2019
2     2018
3     2017
4     2016
<...>
40    1980
Name: Year, dtype: int64
Before we wrap it up and assign these values back to our DataFrame, there is one other item
to discuss. Some of these columns should be integers and some are floats. If we use
pd.numeric()
we don’t have that much flexibility. Using
astype()
we can control the numeric type
but we don’t want to have to manually type this for each column.
The
astype()
function can take a dictionary of column names and data types.
This is really useful and I did not know this until I wrote this article. Here is how we
can define the column data type mapping:
col_type = {
    'Year': 'int',
    'Nominal GDP(in bil. US-Dollar)': 'float',
    'GDP per capita(in US-Dollar)': 'int',
    'GDP growth(real)': 'float',
    'Inflation rate(in percent)': 'float',
    'Unemployment (in percent)': 'float',
    'Budget balance(in % of GDP)[107]': 'float',
    'Government debt held by public(in % of GDP)[108]': 'float',
    'Current account balance(in % of GDP)': 'float'
}
Here’s a quick hint. Typing this dictionary is slow. Use this shortcut to build up
a dictionary of the columns with
float
as the default value:
dict.fromkeys(df_GDP.columns, 'float')
{'Year': 'float',
'Nominal GDP(in bil. US-Dollar)': 'float',
'GDP per capita(in US-Dollar)': 'float',
'GDP growth(real)': 'float',
'Inflation rate(in percent)': 'float',
'Unemployment (in percent)': 'float',
'Budget balance(in % of GDP)[107]': 'float',
'Government debt held by public(in % of GDP)[108]': 'float',
'Current account balance(in % of GDP)': 'float'}
I also created a single dictionary with the values to replace:
clean_dict = {'%': '', '−': '-', '\(est\)': ''}
Now we can call replace on this DataFrame, convert to the desired type and get our clean numeric values:
df_GDP = df_GDP.replace(clean_dict, regex=True).replace({
    '-n/a ': np.nan
}).astype(col_type)
df_GDP.info()
<class 'pandas.core.frame.DataFrame'>
RangeIndex: 41 entries, 0 to 40
Data columns (total 9 columns):
#   Column                                            Non-Null Count  Dtype
---  ------                                            --------------  -----
0   Year                                              41 non-null     int64
1   Nominal GDP(in bil. US-Dollar)                    41 non-null     float64
2   GDP per capita(in US-Dollar)                      41 non-null     int64
3   GDP growth(real)                                  41 non-null     float64
4   Inflation rate(in percent)                        41 non-null     float64
5   Unemployment (in percent)                         41 non-null     float64
6   Budget balance(in % of GDP)[107]                  40 non-null     float64
7   Government debt held by public(in % of GDP)[108]  41 non-null     float64
8   Current account balance(in % of GDP)              40 non-null     float64
dtypes: float64(7), int64(2)
memory usage: 3.0 KB
Which looks like this now:
| Year | Nominal GDP(in bil. US-Dollar) | GDP per capita(in US-Dollar) | GDP growth(real) | Inflation rate(in percent) | Unemployment (in percent) | Budget balance(in % of GDP)[107] | Government debt held by public(in % of GDP)[108] | Current account balance(in % of GDP) | |
|---|---|---|---|---|---|---|---|---|---|
| 0 | 2020 | 20234.0 | 57589 | -5.9 | 0.62 | 11.1 | NaN | 79.9 | NaN |
| 1 | 2019 | 21439.0 | 64674 | 2.2 | 1.80 | 3.5 | -4.6 | 78.9 | -2.5 |
| 2 | 2018 | 20580.2 | 62869 | 3.0 | 2.40 | 3.9 | -3.8 | 77.8 | -2.4 |
| 3 | 2017 | 19519.4 | 60000 | 2.3 | 2.10 | 4.4 | -3.4 | 76.1 | -2.3 |
| 4 | 2016 | 18715.0 | 57878 | 1.7 | 1.30 | 4.9 | -3.1 | 76.4 | -2.3 |
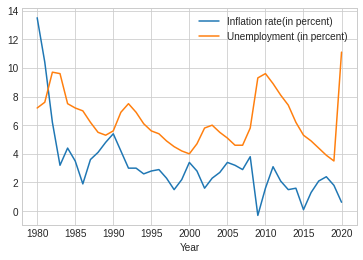
Just to prove it works, we can plot the data too:
plt.style.use('seaborn-whitegrid')
df_clean.plot.line(x='Year', y=['Inflation rate(in percent)', 'Unemployment (in percent)'])
If you are closely following along, you may have noticed the use of a chained
replace
call:
.replace({'-n/a ': np.nan})
The reason I put that in there is that I could not figure out how to get the
n/a
cleaned using
the first dictionary
replace
. I think the issue is that I could not predict the order in which
this data would get cleaned so I decided to execute the replace in two stages.
I’m confident that if there is a better way someone will point it out in the comments.
Full Solution
Here is a compact example of everything we have done. Hopefully this is useful to others that try to ingest data from HTML tables and use them in a pandas DataFrame:
import pandas as pd
import numpy as np
from unicodedata import normalize

def clean_normalize_whitespace(x):
    """ Normalize unicode characters and strip trailing spaces
    """
    if isinstance(x, str):
        return normalize('NFKC', x).strip()
    else:
        return x

# Read in the Wikipedia page and get the DataFrame
table_GDP = pd.read_html(
    'https://en.wikipedia.org/wiki/Economy_of_the_United_States',
    match='Nominal GDP')
df_GDP = table_GDP[0]

# Clean up the DataFrame and Columns
df_GDP = df_GDP.applymap(clean_normalize_whitespace)
df_GDP.columns = df_GDP.columns.to_series().apply(clean_normalize_whitespace)

# Determine numeric types for each column
col_type = {
    'Year': 'int',
    'Nominal GDP(in bil. US-Dollar)': 'float',
    'GDP per capita(in US-Dollar)': 'int',
    'GDP growth(real)': 'float',
    'Inflation rate(in percent)': 'float',
    'Unemployment (in percent)': 'float',
    'Budget balance(in % of GDP)[107]': 'float',
    'Government debt held by public(in % of GDP)[108]': 'float',
    'Current account balance(in % of GDP)': 'float'
}

# Values to replace
clean_dict = {'%': '', '−': '-', '\(est\)': ''}

# Replace values and convert to numeric values
df_GDP = df_GDP.replace(clean_dict, regex=True).replace({
    '-n/a ': np.nan
}).astype(col_type)
Summary
The pandas
read_html()
function is useful for quickly parsing HTML tables in pages - especially
in Wikipedia pages. By the nature of HTML, the data is frequently not going to be as clean as
you might need and cleaning up all the stray unicode characters can be time consuming.
This article showed several techniques you can use to clean the data and convert it to the
proper numeric format. If you find yourself needing to scrape some Wikipedia or other HTML tables,
these tips should save you some time.
If this is helpful to you or you have other tips, feel free to let me know in the comments.
Comments