Reading Poorly Structured Excel Files with Pandas
Posted by Chris Moffitt in articles
Introduction
With pandas it is easy to read Excel files and convert the data into a DataFrame. Unfortunately Excel files in the real world are often poorly constructed. In those cases where the data is scattered across the worksheet, you may need to customize the way you read the data. This article will discuss how to use pandas and openpyxl to read these types of Excel files and cleanly convert the data to a DataFrame suitable for further analysis.
The Problem
The pandas
read_excel
function does an excellent job of reading Excel worksheets.
However, in cases where the data is not a continuous table starting at cell A1, the results may not
be what you expect.
If you try to read in this sample spreadsheet using
read_excel(src_file)
:
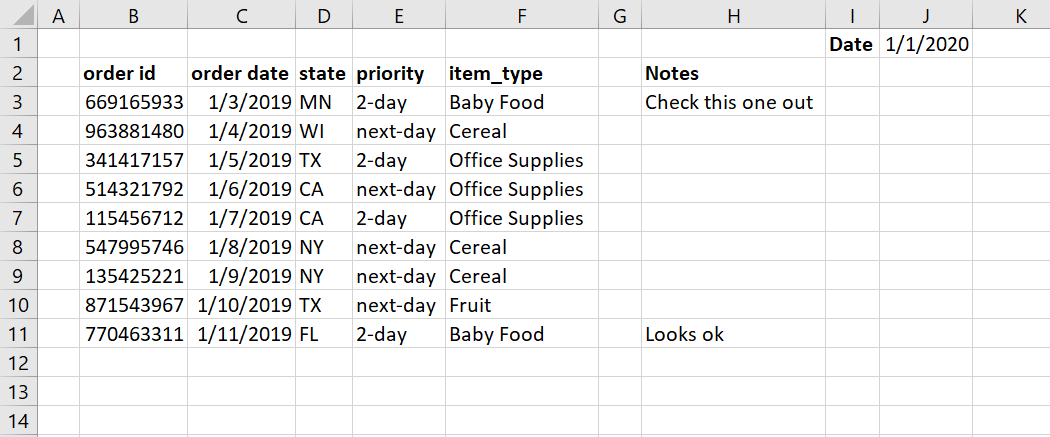
You will get something that looks like this:
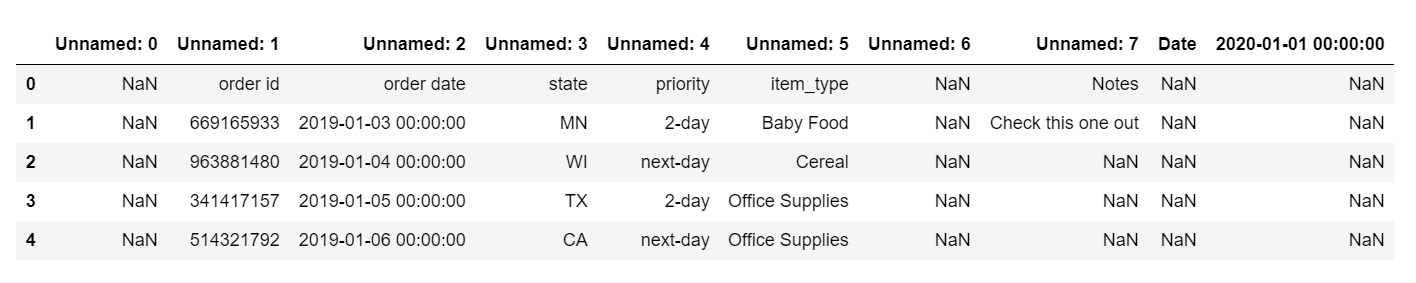
These results include a lot of
Unnamed
columns, header labels within a row as
well as several extra columns we don’t need.
Pandas Solutions
The simplest solution for this data set is to use the
header
and
usecols
arguments
to
read_excel()
. The
usecols
parameter, in particular, can be very useful
for controlling the columns you would like to include.
If you would like to follow along with these examples, the file is on github.
Here is one alternative approach to read only the data we need.
import pandas as pd
from pathlib import Path
src_file = Path.cwd() / 'shipping_tables.xlsx'
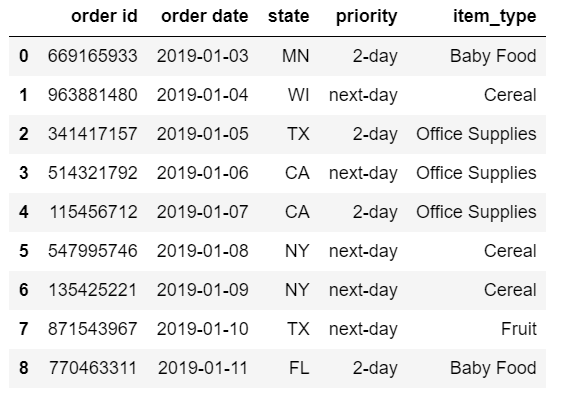
df = pd.read_excel(src_file, header=1, usecols='B:F')
The resulting DataFrame only contains the data we need. In this example, we purposely exclude the notes column and date field:
The logic is relatively straightforward.
usecols
can accept Excel ranges such as
B:F
and read in only those columns. The
header
parameter expects a single integer that defines
the header column. This value is 0-indexed so we pass in
1
even though this is
row 2 in Excel.
In some instance, we may want to define the columns as a list of numbers. In this example, we could define the list of integers:
df = pd.read_excel(src_file, header=1, usecols=[1,2,3,4,5])
This approach might be useful if you have some sort of numerical pattern you want to follow for a large data set (i.e. every 3rd column or only even numbered columns).
The pandas
usecols
can also take a list of column names. This code will create an
equivalent DataFrame:
df = pd.read_excel(
    src_file,
    header=1,
    usecols=['item_type', 'order id', 'order date', 'state', 'priority'])
Using a list of named columns is going to be helpful if the column order changes but you know the names will not change.
Finally,
usecols
can take a callable function. Here’s a simple long-form example
that excludes unnamed columns as well as the priority column.
# Define a more complex function:
def column_check(x):
    if 'unnamed' in x.lower():
        return False
    if 'priority' in x.lower():
        return False
    if 'order' in x.lower():
        return True
    return True

df = pd.read_excel(src_file, header=1, usecols=column_check)
The key concept to keep in mind is that the function will parse each column by name and must
return a
True
or
False
for each column. Those columns that get evaluated to
True
will be included.
Another approach to using a callable is to include a
lambda
expression. Here is an example
where we want to include only a defined list of columns. We normalize the names
by converting them to lower case for comparison purposes.
cols_to_use = ['item_type', 'order id', 'order date', 'state', 'priority']
df = pd.read_excel(src_file,
                   header=1,
                   usecols=lambda x: x.lower() in cols_to_use)
Callable functions give us a lot of flexibility for dealing with the real world messiness of Excel files.
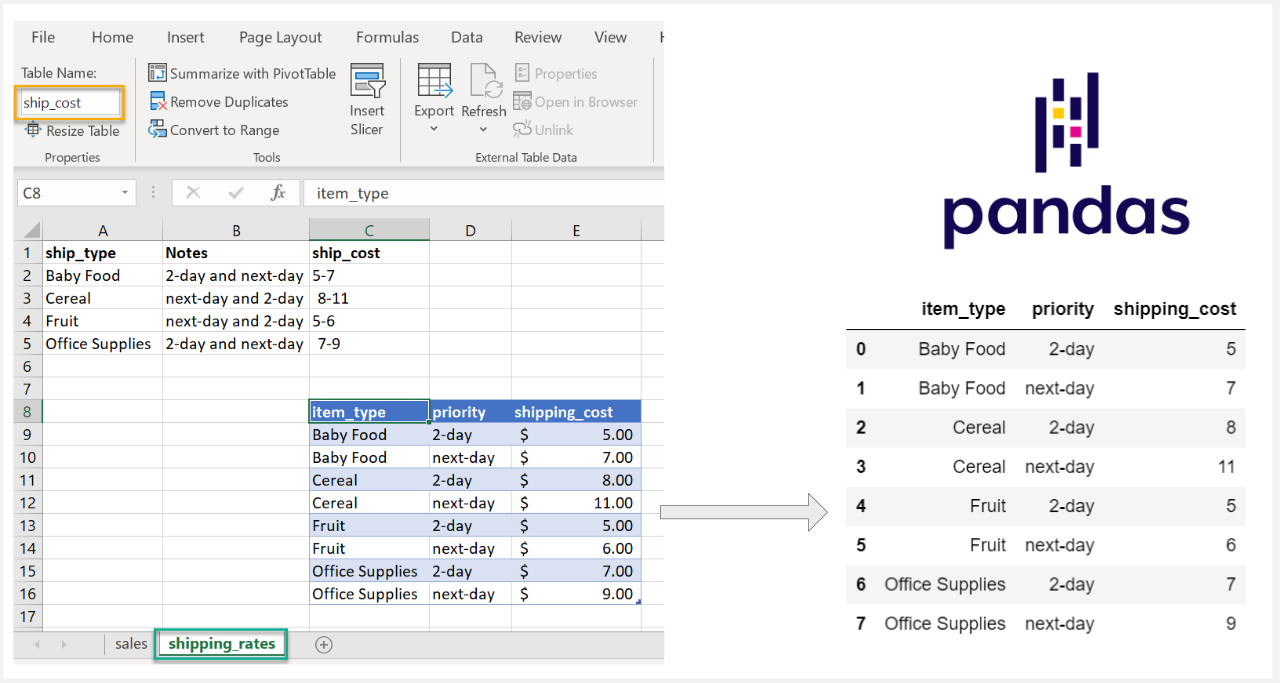
Ranges and Tables
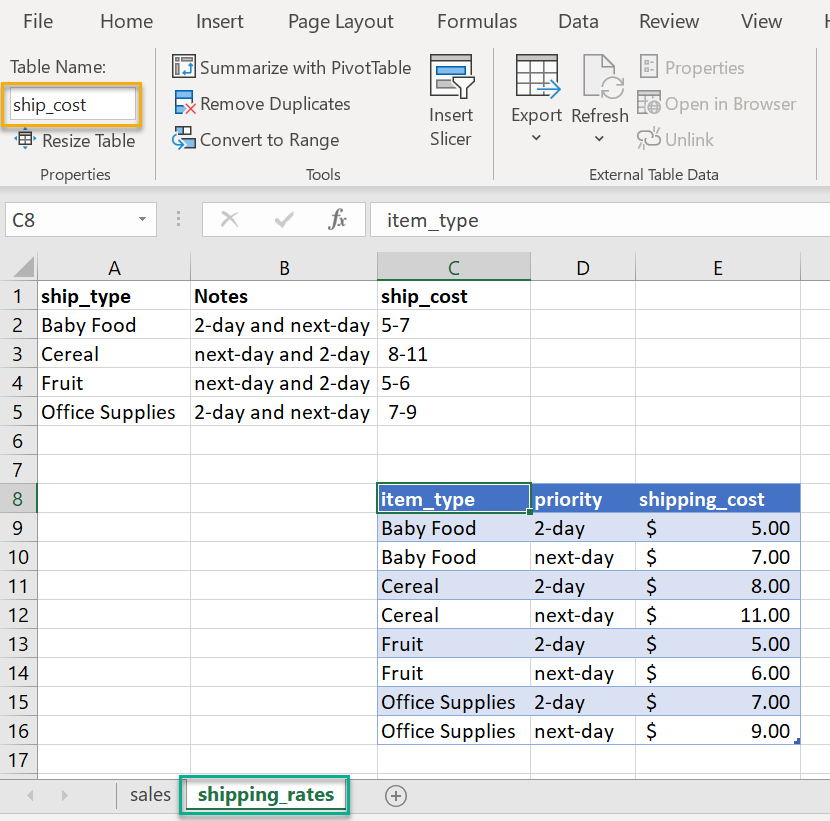
In some cases, the data could be even more obfuscated in Excel. In this example, we have
a table called
ship_cost
that we want to read. If you must work with a file like this,
it might be challenging to read in with the pandas options we have discussed so far.
In this case, we can use openpyxl directly to parse the file and convert the data into a pandas DataFrame. The fact that the data is in an Excel table can make this process a little easier.
Here’s how to use openpyxl (once it is installed) to read the Excel file:
from openpyxl import load_workbook
import pandas as pd
from pathlib import Path
src_file = src_file = Path.cwd() / 'shipping_tables.xlsx'

wb = load_workbook(filename = src_file)
This loads the whole workbook. If we want to see all the sheets:
wb.sheetnames
['sales', 'shipping_rates']
To access the specific sheet:
sheet = wb['shipping_rates']
To see a list of all the named tables:
sheet.tables.keys()
dict_keys(['ship_cost'])
This key corresponds to the name we assigned in Excel to the table. Now we access the table to get the equivalent Excel range:
lookup_table = sheet.tables['ship_cost']
lookup_table.ref
'C8:E16'
This worked. We now know the range of data we want to load. The final step is to convert that range to a pandas DataFrame. Here is a short code snippet to loop through each row and convert to a DataFrame:
# Access the data in the table range
data = sheet[lookup_table.ref]
rows_list = []

# Loop through each row and get the values in the cells
for row in data:
    # Get a list of all columns in each row
    cols = []
    for col in row:
        cols.append(col.value)
    rows_list.append(cols)

# Create a pandas dataframe from the rows_list.
# The first row is the column names
df = pd.DataFrame(data=rows_list[1:], index=None, columns=rows_list[0])
Here is the resulting DataFrame:
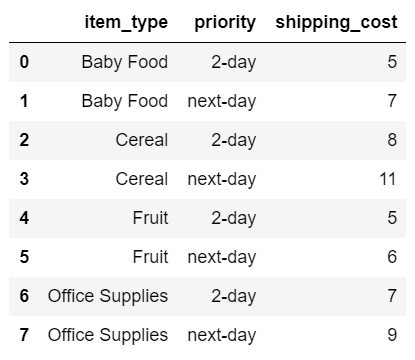
Now we have the clean table and can use for further calculations.
Summary
In an ideal world, the data we use would be in a simple consistent format. See this paper for a nice discussion of what good spreadsheet practices look like.
In the examples in this article, you could easily delete rows and columns to make this more well-formatted. However, there are times where this is not feasible or advisable. The good news is that pandas and openpyxl give us all the tools we need to read Excel data - no matter how crazy the spreadsheet gets.
Changes
- 21-Oct-2020: Clarified that we don’t want to include the notes column
Comments