Building a Repeatable Data Analysis Process with Jupyter Notebooks
Posted by Chris Moffitt in articles
Introduction
Over the past couple of months, there has been an ongoing discussion about Jupyter Notebooks affectionately called the “Notebook Wars”. The genesis of the discussion is Joel Grus’ presentation I Don’t Like Notebooks and has been followed up with Tim Hopper’s response, aptly titled I Like Notebooks. There have been several follow-on posts on this topic including thoughtful analysis from Yihui Xie.
The purpose of this post is to use some of the points brought up in these discussions as a background for describing my personal best practices for the analysis I frequently perform with notebooks. In addition, this approach can be tailored for your unique situation. I think many new python users do not take the time to think through some of these items I discuss. My hope is that this article will spark some discussion and provide a framework that others can build off for making repeatable and easy to understand data analysis pipelines that fit their needs.
Specific Use Cases
My use case is much narrower than what Joel describes. As much as possible, I try to use a Jupyter Notebook as my go-to solution when I need to do moderately complex data analysis in a business setting. Instead of creating an Excel spreadsheet, I build a consistent set of notebook files to document my analysis journey. The key distinctions between my approach and the data science scenarios discussed in the presentations above are:
- This analysis is only used by me. I do not share actual python code with anyone. All results are shared by other means (email, presentations, Excel, etc).
- I do not build models that are put into production.
- All analysis is internal, proprietary and not shared publicly.
- If a solution needs to be used by others, I will build a standalone python script for them to use.
- The vast majority of work I describe is data wrangling, EDA and simple statistical analysis. The work is the bread and butter work that Excel is used for in most organizations.
The rest of this article will outline the approach I use in the hopes it can be a framework for others and might help people develop their own repeatable and maintainable work flow.
Why Have Standards?
I imagine that most people that have used Jupyter Notebooks for any significant time have ended up with a directory structure that looks like this:
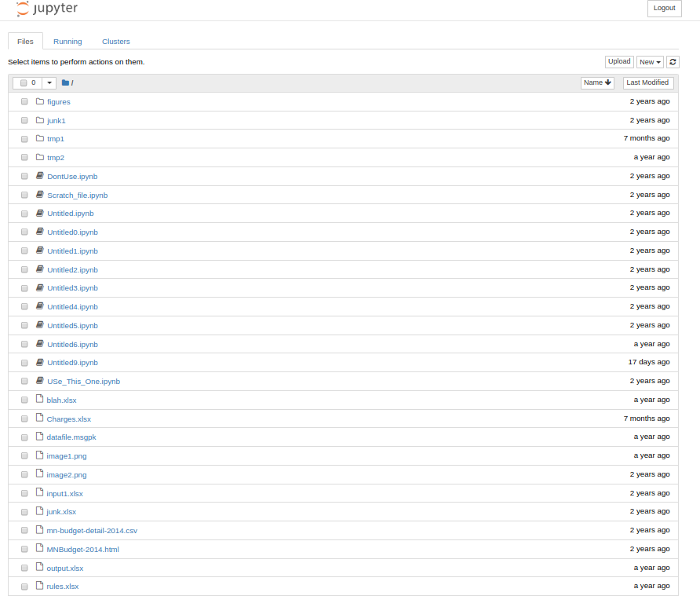
At a quick glance, there are a lot of problems with this “structure:”
- Inconsistent or absent naming scheme for notebooks
- Mixture of notebooks, scripts, Excel, CSV, images, etc all in one directory
- Vague directory names
- Difficult to follow “flow” of the processing steps
On top of the non-intuitive structure, each notebook has its own unique structure for analyzing data. Some are documented but many are not. None of these issues is a flaw with notebooks per se but is an example of a sloppy approach to solving a problem. You could just as easily end up with this situation with Excel files or stand alone python scripts.
I’ve certainly done all of the things described above. It is incredibly frustrating when I know I did some really useful analysis but I can’t find it 6 months after the fact. If only I had a little more discipline up front, it would have saved a lot of time over the long run.
One of my biggest complaints about Excel is that it is really difficult to understand how the data was pulled together and how all the cells, formulas and VBA relate to each other. There are very limited options for documenting Excel data analysis flow. I believe that using a well-formed Jupyter Notebook structure can lead to a much more reusable set of data analysis artifacts.
Directory Structures
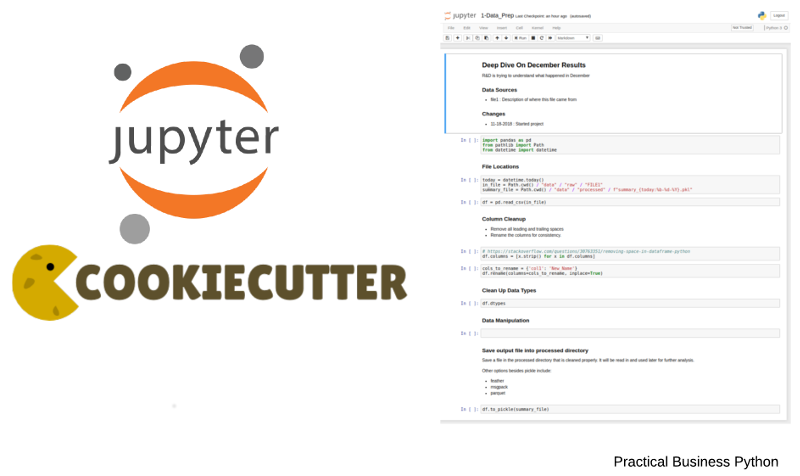
The first step in the process is creating a consistent directory structure. I have leveraged very heavily from the Cookiecutter Data Science project. If you are doing more complex modeling and sharing code with others, then I encourage you to use the above mentioned cookiecutter framework.
In general, I create a new directory for each analysis and take the time to give the directory a descriptive name. Then, I setup the following directory structure:
FY_18_Sales_Comp/
  ├── 1-Data_Prep.ipynb
  ├── 2-EDA.ipynb
  ├── data
  │   ├── interim
  │   ├── processed
  │   └── raw
  └── reports
I will cover the details of the notebooks in a bit but the important item to note
is that I include a number followed by the stage in the analysis process. This convention
helps me quickly figure out where I need to go to learn more. If I’m just interested in
the final analysis, I look in the
2-EDA
notebook. If I need to see where the data
comes from, I can jump into
1-Data_Prep
. I will often create multiple EDA files as I
am working through the analysis and try to be as careful as possible about the naming
structure so I can see how items are related.
The other key structural issue is that the input and output files are stored in different directories:
raw- Contains the unedited csv and Excel files used as the source for analysis.interim- Used if there is a multi-step manipulation. This is a scratch location and not always needed but helpful to have in place so directories do not get cluttered or as a temp location form troubleshooting issues.processed- In many cases, I read in multiple files, clean them up and save them to a new location in a binary format. This streamlined format makes it easier to read in larger files later in the processing pipeline.
Finally, any Excel, csv or image output files are stored in the
reports
directory.
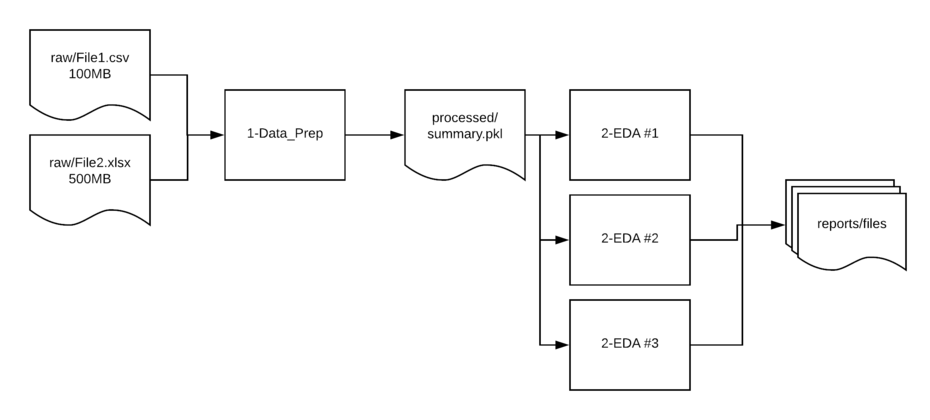
Here is a simple diagram of how the data typically flows in these types of scenarios:
Notebook Structure
Once I create each notebook, I try to follow consistent processes for describing the notebooks. The key point to keep in mind is that this header is the first thing you will see when you are trying to figure out how the notebook was used. Trust me, future you will be eternally thankful if you take the time to put some of these comments in the notebook!
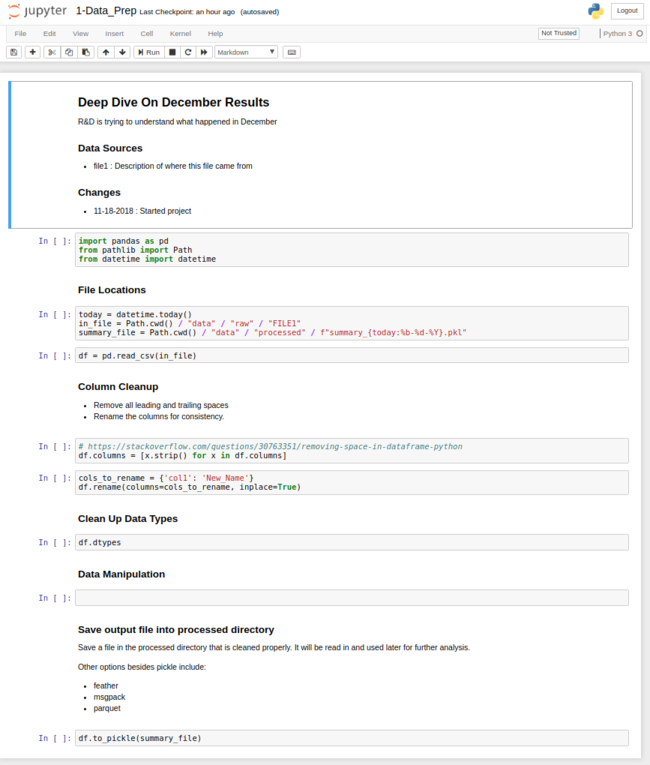
Here’s an image of the top of an example notebook:
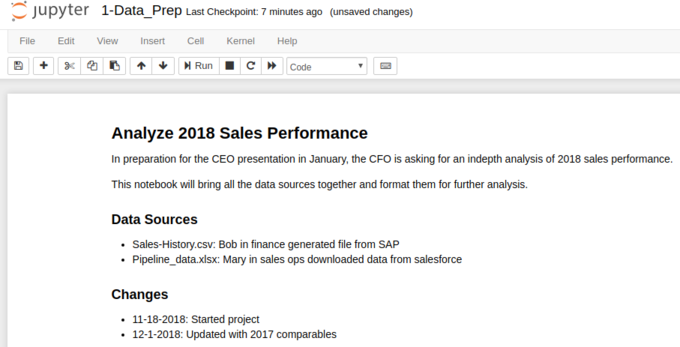
There are a couple of points I always try to include:
- A good name for the notebook (as described above)
- A summary header that describes the project
- Free form description of the business reason for this notebook. I like to include names, dates and snippets of emails to make sure I remember the context.
- A list of people/systems where the data originated.
- I include a simple change log. I find it helpful to record when I started and any major changes along the way. I do not update it with every single change but having some date history is very beneficial.
I tend to include similar imports in most of my notebooks:
import pandas as pd
from pathlib import Path
from datetime import datetime
Then I define all my input and output file paths and directories. It is very useful to
do this all in one place at the top of the file. The other key thing I try to do
is make all of my file path references relative to the notebook directory. By
using
Path.cwd()
I can move notebook directories around and it will still work.
I also like to include date and time stamps in the file names. The new f-strings plus pathlib make this simple:
today = datetime.today()
sales_file = Path.cwd() / "data" / "raw" / "Sales-History.csv"
pipeline_file = Path.cwd() / "data" / "raw" / "pipeline_data.xlsx"
summary_file = Path.cwd() / "data" / "processed" / f"summary_{today:%b-%d-%Y}.pkl"
If you are not familiar with the Path object, my previous article might be useful.
The other important item to keep in mind is that raw files should NEVER be modified.
The next section of most of my notebooks includes a section to clean up column names. My most common steps are:
- Remove leading and trailing spaces in column names
- Align on a naming convention (dunder, CamelCase, etc.) and stick with it
- When renaming columns, do not include dashes or spaces in names
- Use a rename dictionary to put all the renaming options in one place
- Align on a name for the same value. Account Num, Num, Account ID might all be the same. Name them that way!
- Abbreviations may be ok but make sure it is consistent (for example - always use num vs number)
After cleaning up the columns, I make sure all the data is in the type I expect/need. This previous article on data types should be helpful:
- If you have a need for a date column, make sure it is stored as one.
- Numbers should be
intorfloatand notobject - Categorical types can be used based on your discretion
- If it is a Yes/No, True/False or 1/0 field make sure it is a
boolean - Some data like US zip codes or customer numbers might come in with a leading 0.
If you need to preserve the leading 0, then use an
objecttype.
Once the column names are cleaned up and the data types are correct, I will do the manipulation of the data to get it in the format I need for further analysis.
Here are a few other guidelines to keep in mind:
If you find a particular tricky piece of code that you want to include, be sure to keep a link to where you found it in the notebook.
When saving files to Excel, I like to create an
ExcelWriterobject so I can easily save multiple sheets to the output file. Here is what it looks like:writer = pd.ExcelWriter(report_file, engine='xlsxwriter') df.to_excel(writer, sheet_name='Report') writer.save()
Operationalizing & Customing This Approach
There are a lot of items highlighted here to keep in mind. I am hopeful that readers have thought of their own ideas as well. Fortunately, you can build a simple framework that is easy to replicate for your own analysis by using the cookiecutter project to build your own template. I have placed an example based on this project on github.
Once you install cookiecutter, you can replicate this structure for your own projects:
$ cookiecutter https://github.com/chris1610/pbp_cookiecutter
$ project_name [project_name]: Deep Dive On December Results
$ directory_name [deep_dive_on_december_results]:
$ description [More background on the project]: R&D is trying to understand what happened in December
After answering these questions, you will end up with the directory structure and a sample notebook that looks like this:
The nice result of this approach is that you only need to answer a couple of simple questions to get the template started and populate the notebook with some of the basic project description. My hope is that this lightweight approach will be easy to incorporate into your analysis. I feel this providew a framework for repeatable analysis but is not so burdensome that you do not want to use it because of the additional work in implementing it.
In addition, if you find this approach useful, you could tailor it even more
for your own needs by adding conditional logic to the process or capturing additional
information to include in the notebooks. One idea I have played around with is
including a
snippets.py
file in the cookiecutter template where I save some of
my random/useful code that I use frequently.
I’ll be curious what others think about this approach and any ideas you may have incorporated in your own workflow. Feel free to chime in below with your input in the comments below.
Comments