Improving Pandas Excel Output
Posted by Chris Moffitt in articles
Introduction
Pandas makes it very easy to output a DataFrame to Excel. However, there are limited
options for customizing the output and using Excel’s features to make your output
as useful as it could be. Fortunately, it is easy to use the excellent XlsxWriter
module to customize and enhance the Excel workbooks created by Panda’s
to_excel
function. This article will describe how to use XlsxWriter and Pandas to make complex,
visually appealing and useful Excel workbooks. As an added bonus, the article will briefly
discuss the use of the new
assign
function that has been introduced in pandas 0.16.0.
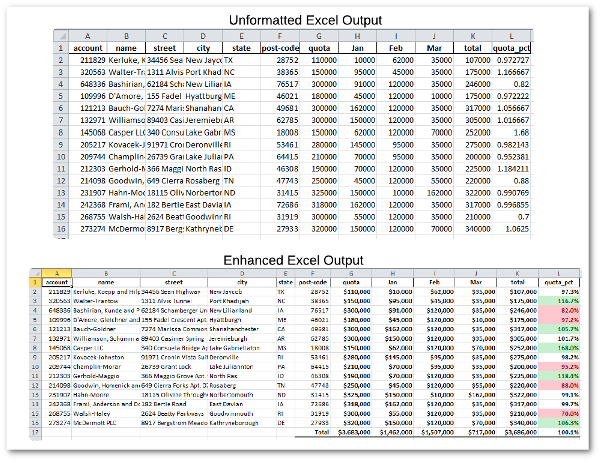
Since this is a discussion about making Excel look better, a visual will probably be a quicker way to show what we can accomplish with a little bit of extra python code on top of the standard pandas library.
Background
If you are not familiar with pandas and how to use it to manipulate data, some of these prior articles might put it in perspective:
- Common Excel Tasks Demonstrated in Pandas
- Common Excel Tasks Demonstrated in Pandas - Part 2
- Combining Multiple Excel Files
One other point to clarify is that you must be using pandas 0.16 or higher
to use
assign
. In addition there was a subtle bug in prior pandas versions
that would not allow the formatting to work correctly when using XlsxWriter
as shown below.
For the purposes of this article, I will be using data very similar to the ones described in Common Excel Tasks Demonstrated in Pandas.
Simple Output
Let’s get started by importing pandas, numpy and
xl_rowcol_to_cell
.
import pandas as pd
import numpy as np
from xlsxwriter.utility import xl_rowcol_to_cell
Read in the file.
df = pd.read_excel("excel-comp-datav2.xlsx")
df.head()
| account | name | street | city | state | post-code | quota | Jan | Feb | Mar | |
|---|---|---|---|---|---|---|---|---|---|---|
| 0 | 211829 | Kerluke, Koepp and Hilpert | 34456 Sean Highway | New Jaycob | TX | 28752 | 110000 | 10000 | 62000 | 35000 |
| 1 | 320563 | Walter-Trantow | 1311 Alvis Tunnel | Port Khadijah | NC | 38365 | 150000 | 95000 | 45000 | 35000 |
| 2 | 648336 | Bashirian, Kunde and Price | 62184 Schamberger Underpass Apt. 231 | New Lilianland | IA | 76517 | 300000 | 91000 | 120000 | 35000 |
| 3 | 109996 | D’Amore, Gleichner and Bode | 155 Fadel Crescent Apt. 144 | Hyattburgh | ME | 46021 | 180000 | 45000 | 120000 | 10000 |
| 4 | 121213 | Bauch-Goldner | 7274 Marissa Common | Shanahanchester | CA | 49681 | 300000 | 162000 | 120000 | 35000 |
This dummy data shows account sales for Jan, Feb and March as well as the quota for each of these accounts. What we are going to do is summarize the data and see how close each account was towards hitting its quota.
Get the number of rows to make it easier to add our Excel formulas a little later.
number_rows = len(df.index)
As of pandas 0.16, there is a new function called
assign
that is useful here
to add some total data.
# Add some summary data using the new assign functionality in pandas 0.16
df = df.assign(total=(df['Jan'] + df['Feb'] + df['Mar']))
df.head()
| account | name | street | city | state | post-code | quota | Jan | Feb | Mar | total | |
|---|---|---|---|---|---|---|---|---|---|---|---|
| 0 | 211829 | Kerluke, Koepp and Hilpert | 34456 Sean Highway | New Jaycob | TX | 28752 | 110000 | 10000 | 62000 | 35000 | 107000 |
| 1 | 320563 | Walter-Trantow | 1311 Alvis Tunnel | Port Khadijah | NC | 38365 | 150000 | 95000 | 45000 | 35000 | 175000 |
| 2 | 648336 | Bashirian, Kunde and Price | 62184 Schamberger Underpass Apt. 231 | New Lilianland | IA | 76517 | 300000 | 91000 | 120000 | 35000 | 246000 |
| 3 | 109996 | D’Amore, Gleichner and Bode | 155 Fadel Crescent Apt. 144 | Hyattburgh | ME | 46021 | 180000 | 45000 | 120000 | 10000 | 175000 |
| 4 | 121213 | Bauch-Goldner | 7274 Marissa Common | Shanahanchester | CA | 49681 | 300000 | 162000 | 120000 | 35000 | 317000 |
We can also use
assign
to show how close accounts are towards their quota.
df = df.assign(quota_pct=(1+(df['total'] - df['quota'])/df['quota']))
df.head()
| account | name | street | city | state | post-code | quota | Jan | Feb | Mar | total | quota_pct | |
|---|---|---|---|---|---|---|---|---|---|---|---|---|
| 0 | 211829 | Kerluke, Koepp and Hilpert | 34456 Sean Highway | New Jaycob | TX | 28752 | 110000 | 10000 | 62000 | 35000 | 107000 | 0.972727 |
| 1 | 320563 | Walter-Trantow | 1311 Alvis Tunnel | Port Khadijah | NC | 38365 | 150000 | 95000 | 45000 | 35000 | 175000 | 1.166667 |
| 2 | 648336 | Bashirian, Kunde and Price | 62184 Schamberger Underpass Apt. 231 | New Lilianland | IA | 76517 | 300000 | 91000 | 120000 | 35000 | 246000 | 0.820000 |
| 3 | 109996 | D’Amore, Gleichner and Bode | 155 Fadel Crescent Apt. 144 | Hyattburgh | ME | 46021 | 180000 | 45000 | 120000 | 10000 | 175000 | 0.972222 |
| 4 | 121213 | Bauch-Goldner | 7274 Marissa Common | Shanahanchester | CA | 49681 | 300000 | 162000 | 120000 | 35000 | 317000 | 1.056667 |
As a side note, I personally like the
assign
function for adding
these types of additional columns. Here is how you could add a total without assign:
df["total"] = df["Jan"] + df["Feb"] + df["Mar"]
Save this data using the simple
to_excel
process.
writer_orig = pd.ExcelWriter('simple.xlsx', engine='xlsxwriter')
df.to_excel(writer_orig, index=False, sheet_name='report')
writer_orig.save()
Here is what the simple file looks like:
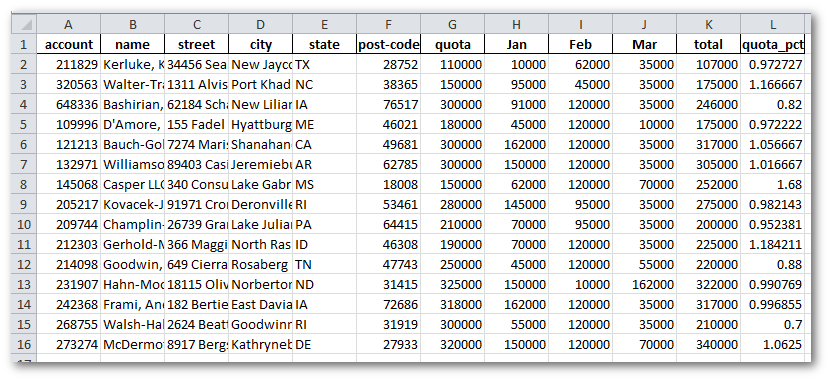
You will notice a couple of things that would be nice to fix:
- The column widths make it tough to see all the data
- The sales and percentages are not formmatted as dollars or %’s
- There is no total information.
- Overall it is pretty boring.
Complex Output
With just a little more coding, we can create a more sophisticated output.
We create another writer and use the
to_excel
to create our workbook.
writer = pd.ExcelWriter('fancy.xlsx', engine='xlsxwriter')
df.to_excel(writer, index=False, sheet_name='report')
The key is to get access to the worksheet which enables us to use all the XlsxWriter capability available in that library.
workbook = writer.book
worksheet = writer.sheets['report']
Now that we have the worksheet, we can do anything that xlsxwriter supports. If you have not done so yet, I encourage you to take a look at the XlsxWriter docs. They are very well written and show you all the capabilities available for customizing Excel output. By accessing the worksheet as shown above, you can easily drop in all XlsxWriter’s features into your output.
I’ll walk through a few of them to give you some ideas. First, we resize the sheet by adjusting the zoom.
worksheet.set_zoom(90)
Some of our biggest improvements come through formatting the columns to make
the data more readable.
add_format
is very useful for
improving your standard output.
Here are two examples of formatting numbers:
# Add a number format for cells with money.
money_fmt = workbook.add_format({'num_format': '$#,##0', 'bold': True})

# Add a percent format with 1 decimal point
percent_fmt = workbook.add_format({'num_format': '0.0%', 'bold': True})
This example shows how to add additional formatting including underlines.
# Total formatting
total_fmt = workbook.add_format({'align': 'right', 'num_format': '$#,##0',
                                 'bold': True, 'bottom':6})
# Total percent format
total_percent_fmt = workbook.add_format({'align': 'right', 'num_format': '0.0%',
                                         'bold': True, 'bottom':6})
Change the size of several columns using
set_column
. This can
also be used to apply formatting to a column.
This section changes the size of columns B-F to sizes more appropriate for the data they store.
# Account info columns
worksheet.set_column('B:D', 20)
# State column
worksheet.set_column('E:E', 5)
# Post code
worksheet.set_column('F:F', 10)
In addition to changing the size of G-L, we also can apply the money and percent formatting on the entire column.
# Monthly columns
worksheet.set_column('G:K', 12, money_fmt)
# Quota percent columns
worksheet.set_column('L:L', 12, percent_fmt)
The next section adds a total at the bottom of our data. The biggest challenge
in working with Excel is converting between numeric indices and cell labels.
This loop shows how to loop through the columns numerically but also
use
xl_rowcol_to_cell
to get cell locations.
# Add total rows
for column in range(6, 11):
    # Determine where we will place the formula
    cell_location = xl_rowcol_to_cell(number_rows+1, column)
    # Get the range to use for the sum formula
    start_range = xl_rowcol_to_cell(1, column)
    end_range = xl_rowcol_to_cell(number_rows, column)
    # Construct and write the formula
    formula = "=SUM({:s}:{:s})".format(start_range, end_range)
    worksheet.write_formula(cell_location, formula, total_fmt)
In addition to writing the total label, we want to see what our % to quota is in aggregate.
We construct the string to calculate the percent to quota and write it out
using
write_formula
# Add a total label
worksheet.write_string(number_rows+1, 5, "Total",total_fmt)
percent_formula = "=1+(K{0}-G{0})/G{0}".format(number_rows+2)
worksheet.write_formula(number_rows+1, 11, percent_formula, total_percent_fmt)
The final item to add is the capability to highlight the top 5 values and the bottom 5 values. This gives us a nice visual representation of where we may need to inspect further.
First, we define the range we want to format.
# Define our range for the color formatting
color_range = "L2:L{}".format(number_rows+1)
Then, we define the colors.
# Add a format. Light red fill with dark red text.
format1 = workbook.add_format({'bg_color': '#FFC7CE',
                               'font_color': '#9C0006'})

# Add a format. Green fill with dark green text.
format2 = workbook.add_format({'bg_color': '#C6EFCE',
                               'font_color': '#006100'})
Finally, we apply the conditional formatting and save our output.
# Highlight the top 5 values in Green
worksheet.conditional_format(color_range, {'type': 'top',
                                           'value': '5',
                                           'format': format2})
# Highlight the bottom 5 values in Red
worksheet.conditional_format(color_range, {'type': 'bottom',
                                           'value': '5',
                                           'format': format1})
writer.save()
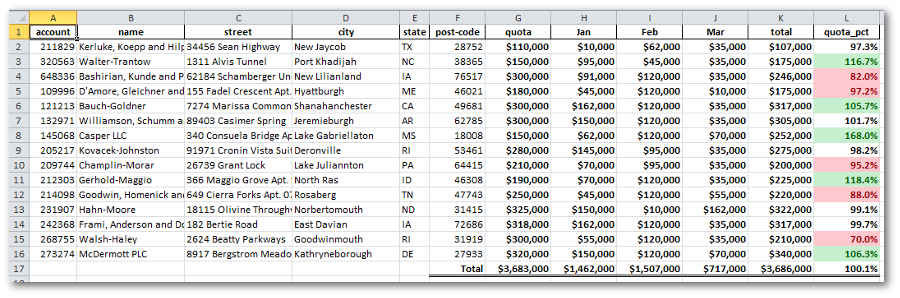
Here is the final output.
Final Thoughts
To pull it all together, here is the complete code:
"""
Show examples of modifying the Excel output generated by pandas
"""
import pandas as pd
import numpy as np

from xlsxwriter.utility import xl_rowcol_to_cell


df = pd.read_excel("../in/excel-comp-datav2.xlsx")

# We need the number of rows in order to place the totals
number_rows = len(df.index)

# Add some summary data using the new assign functionality in pandas 0.16
df = df.assign(total=(df['Jan'] + df['Feb'] + df['Mar']))
df = df.assign(quota_pct=(1+(df['total'] - df['quota'])/df['quota']))

# Create a Pandas Excel writer using XlsxWriter as the engine.
# Save the unformatted results
writer_orig = pd.ExcelWriter('simple.xlsx', engine='xlsxwriter')
df.to_excel(writer_orig, index=False, sheet_name='report')
writer_orig.save()

# Create a Pandas Excel writer using XlsxWriter as the engine.
writer = pd.ExcelWriter('fancy.xlsx', engine='xlsxwriter')
df.to_excel(writer, index=False, sheet_name='report')

# Get access to the workbook and sheet
workbook = writer.book
worksheet = writer.sheets['report']

# Reduce the zoom a little
worksheet.set_zoom(90)

# Add a number format for cells with money.
money_fmt = workbook.add_format({'num_format': '$#,##0', 'bold': True})

# Add a percent format with 1 decimal point
percent_fmt = workbook.add_format({'num_format': '0.0%', 'bold': True})

# Total formatting
total_fmt = workbook.add_format({'align': 'right', 'num_format': '$#,##0',
                                 'bold': True, 'bottom':6})
# Total percent format
total_percent_fmt = workbook.add_format({'align': 'right', 'num_format': '0.0%',
                                         'bold': True, 'bottom':6})

# Format the columns by width and include number formats

# Account info columns
worksheet.set_column('B:D', 20)
# State column
worksheet.set_column('E:E', 5)
# Post code
worksheet.set_column('F:F', 10)

# Monthly columns
worksheet.set_column('G:K', 12, money_fmt)
# Quota percent columns
worksheet.set_column('L:L', 12, percent_fmt)

# Add total rows
for column in range(6, 11):
    # Determine where we will place the formula
    cell_location = xl_rowcol_to_cell(number_rows+1, column)
    # Get the range to use for the sum formula
    start_range = xl_rowcol_to_cell(1, column)
    end_range = xl_rowcol_to_cell(number_rows, column)
    # Construct and write the formula
    formula = "=SUM({:s}:{:s})".format(start_range, end_range)
    worksheet.write_formula(cell_location, formula, total_fmt)

# Add a total label
worksheet.write_string(number_rows+1, 5, "Total",total_fmt)
percent_formula = "=1+(K{0}-G{0})/G{0}".format(number_rows+2)
worksheet.write_formula(number_rows+1, 11, percent_formula, total_percent_fmt)

# Define our range for the color formatting
color_range = "L2:L{}".format(number_rows+1)

# Add a format. Light red fill with dark red text.
format1 = workbook.add_format({'bg_color': '#FFC7CE',
                               'font_color': '#9C0006'})

# Add a format. Green fill with dark green text.
format2 = workbook.add_format({'bg_color': '#C6EFCE',
                               'font_color': '#006100'})

# Highlight the top 5 values in Green
worksheet.conditional_format(color_range, {'type': 'top',
                                           'value': '5',
                                           'format': format2})

# Highlight the bottom 5 values in Red
worksheet.conditional_format(color_range, {'type': 'bottom',
                                           'value': '5',
                                           'format': format1})

writer.save()
There is much more to explore but this quick overview should give you some good ideas about making pandas’ Excel output that much more useful.
Comments